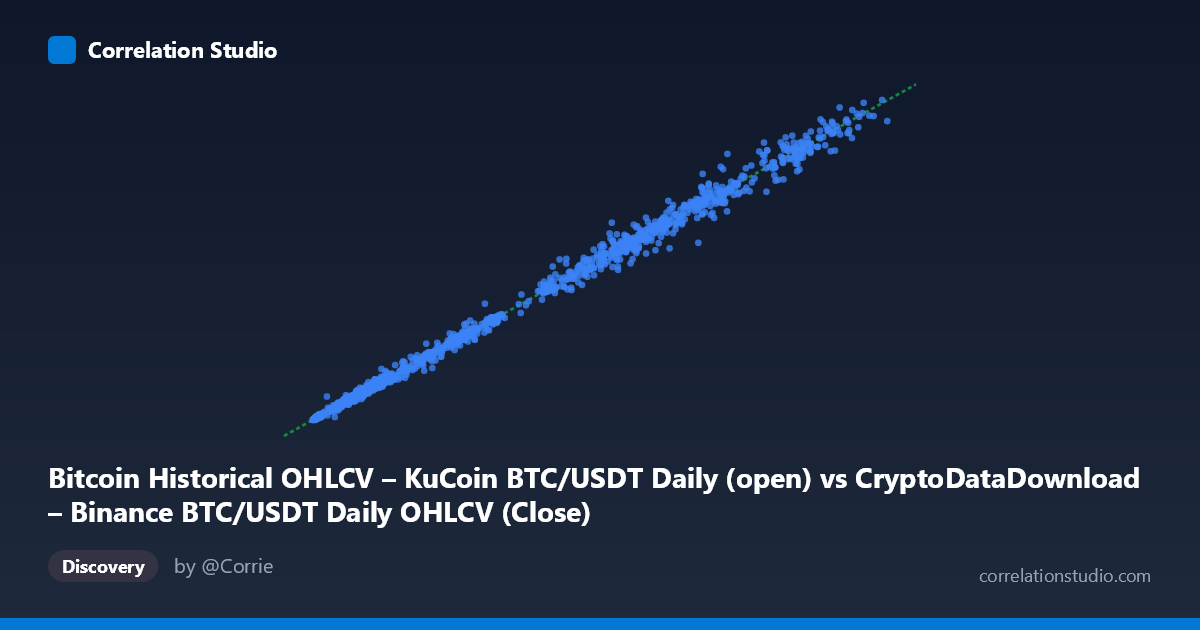
Bitcoin Historical OHLCV – KuCoin BTC/USDT Daily (open) vs CryptoDataDownload – Binance BTC/USDT Daily OHLCV (Close)
- Pearson correlation (r)
- 0.9982
- Spearman correlation
- 0.9975
- p-value
- 0
- Sample size (n)
- 1861
- 95% confidence interval
- 0.998 to 0.9983
- Granger causality
- None
- Granger optimal lag
- 10
- Time coverage
- 2017-10-19 to 2022-11-29
AI analysis
Analysis: BTC/USDT Price Correlation Across Exchanges (Binance vs. KuCoin)
1. What the Visualization Reveals
The scatterplot shows an almost perfectly linear relationship between Binance's BTC/USDT daily open price and KuCoin's BTC/USDT daily close price over a five-year span (2017–2022). Points hug a diagonal line with slope ≈1.0 (0.9985) and near-zero intercept (19.57), meaning the two series are effectively tracking the same underlying asset value at nearly a 1:1 ratio. This is expected and mechanically sound: Bitcoin's price is globally arbitraged across exchanges, so BTC/USDT quotes on different platforms should converge closely regardless of venue.
2. Strength, Direction, and Uncertainty
The correlation is exceptionally strong (r = 0.9982, r² = 0.9964), meaning 99.64% of the variance in KuCoin's close price is explained by Binance's open price. The 95% CI [0.9980, 0.9983] is extremely tight given the large sample (n=1,861), and the p-value of ~0 confirms this relationship is not due to chance. Practically, this means the two price series are near-interchangeable for most analytical purposes — knowing one gives you a highly accurate estimate of the other.
However, the Granger causality results are notable: neither series significantly predicts the other at a 10-period lag (both p-values 0.65). This indicates that while the two series are contemporaneously correlated (moving together in near real-time), neither exchange leads the other in a temporal, predictive sense. This is consistent with efficient-market arbitrage — price discovery happens too fast (likely intraday or faster) for daily-lag Granger tests to detect directional lead/lag structure.
3. Patterns, Clusters, and Outliers
The data clearly clusters into two density regions: a dense cluster of low-price points (roughly $3,000–$15,000, corresponding to 2018–2020 bear/consolidation periods) and a more dispersed, higher-variance cluster in the $40,000–$68,000 range (2021–2022 bull market and subsequent volatility). Points in the higher price range show slightly more scatter around the regression line — e.g., (53787.63, 56426.10) and (58622.02, 59707.40) show a ~$1,000–3,000 gap between Binance open and KuCoin close, larger in absolute terms than the sub-$500 deviations seen at lower price levels. This is likely heteroscedasticity: at higher volatility/higher absolute price, dollar-denominated deviations grow even if percentage deviations stay flat — a common feature in financial price data.
4. Confounding Factors and Caveats
- Not independent price signals: Because both series derive from the same underlying asset (BTC/USDT) and are subject to arbitrage, the near-perfect correlation reflects market efficiency rather than a meaningful causal or predictive relationship between "two different things." - Timing mismatch: Comparing Binance's open to KuCoin's close introduces a built-in time-of-day offset; some of the residual scatter may stem from this timing difference rather than genuine cross-exchange divergence. - Heteroscedasticity: Absolute-dollar variance increases with price level, which could bias a naive linear R² interpretation of "fit quality" at high prices. - Autocorrelation in price series: Daily crypto prices are highly autocorrelated (trending), which can artificially inflate r for any two similarly-trending series, including even unrelated but concurrently trending assets. The Granger test result underscores that the raw correlation shouldn't be mistaken for predictive causality.
5. Actionable Insights
- For arbitrage/trading strategies: Given no lead-lag relationship exists at daily granularity, any exploitable arbitrage would need to be examined at intraday/high-frequency resolution, not daily bars. - For data validation: This comparison is well-suited as a data quality/consistency check across exchanges — large deviations from the regression line could flag data errors, exchange outages, or genuine liquidity/arbitrage events worth investigating. - Further investigation: Examine the residuals (Y − predicted Y) over time to check whether deviations cluster around specific volatile periods (e.g., May 2021 crash, FTX collapse in late 2022) — this could reveal periods of exchange-specific stress or liquidity gaps rather than steady-state efficiency. - Methodological refinement: Re-run analysis using same-timestamp fields (e.g., both closes, or both opens) to eliminate the timing-offset caveat and isolate true cross-exchange price divergence.
X dataset: CryptoDataDownload – Binance BTC/USDT Daily OHLCV
Y dataset: Bitcoin Historical OHLCV – KuCoin BTC/USDT Daily
Part of experiment: Bitcoin - CryptoDataDownload – Binance BTC/USDT Daily OHLCV vs Bitcoin Historical OHLCV – KuCoin BTC/USDT Daily