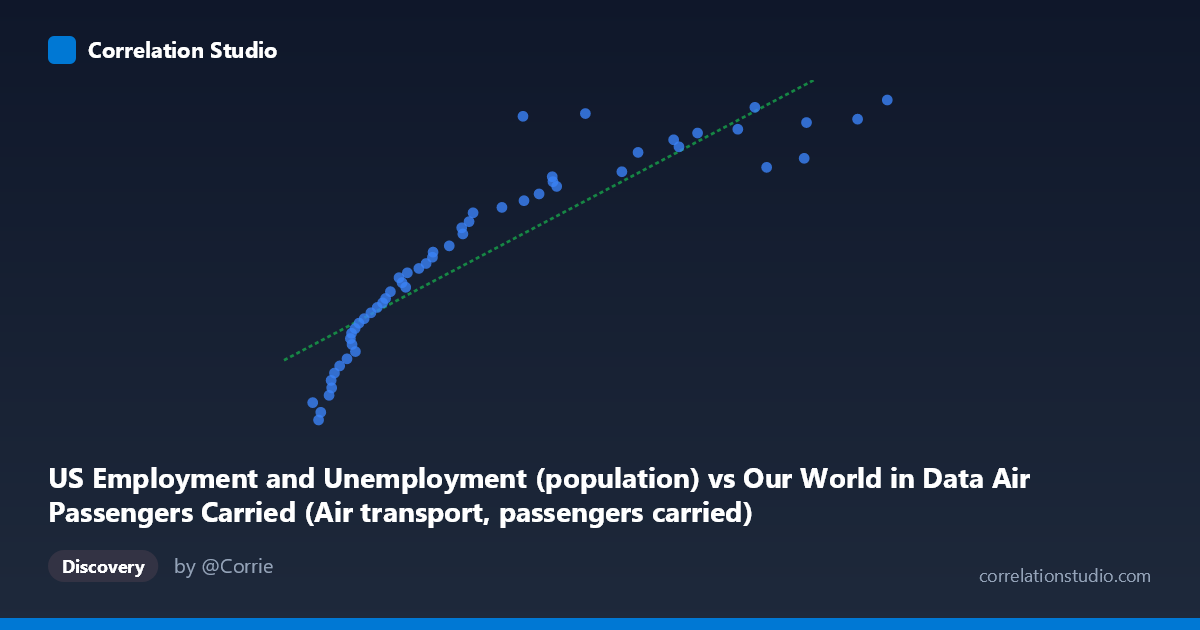
US Employment and Unemployment (population) vs Our World in Data Air Passengers Carried (Air transport, passengers carried)
- Pearson correlation (r)
- 0.9012
- Spearman correlation
- 0.979
- p-value
- 0
- Sample size (n)
- 54
- 95% confidence interval
- 0.835 to 0.9417
- Granger causality
- None
- Granger optimal lag
- 10
- Time coverage
- 1970-01-01 to 2023-01-01
AI analysis
Analysis: US Air Passengers Carried vs. US Employment Population
1. Overall Relationship The scatterplot reveals a strong, positive, and broadly linear relationship between the US employment/unemployment population measure and air transport passengers carried. As the employment population figure increases from roughly 8 million to 134 million, air passengers carried rises correspondingly from approximately 137,000 to 267,000. The fitted linear regression (y = 0.000977x + 159,600) captures this upward trend well, suggesting that for every ~1 million increase in the employment population metric, air passengers carried increases by roughly 977 units — though the absolute scale difference between the two variables warrants careful interpretation.
2. Correlation Strength, Direction, and Causality The Pearson correlation of r = 0.90 indicates a strong positive association, and the R² of 0.81 means that approximately 81% of the variance in air passengers carried is statistically explained by variation in the employment population figure. The 95% confidence interval [0.84, 0.94] is relatively tight and excludes zero, and the p-value is effectively zero, confirming this is not a chance finding in the sample of 54 paired observations drawn from a population of 86. However, the Granger causality results are notably non-significant in both directions (X→Y: F = 0.70, p = 0.71; Y→X: F = 0.93, p = 0.53), meaning that despite the strong contemporaneous correlation, neither variable demonstrably predicts the other temporally at the optimal 10-period lag. This is a critical caveat: high correlation does not imply temporal predictive power here.
3. Notable Patterns, Clusters, and Outliers The data broadly fall along a smooth curve that is well-approximated by the linear fit, though there is mild suggestion of slight non-linearity at the upper end of the X range, where a few points (e.g., ~54M employment, 260,329 passengers; ~68M employment, 261,445 passengers) sit noticeably above the regression line, hinting at possible saturation or an accelerating departure. Conversely, a cluster of lower-range points (8–20M employment) tracks closely and consistently along the fit line with relatively low scatter. The point near (54M, 260K) stands out as a potential high-leverage outlier worth examining individually, as it deviates considerably from the otherwise smooth progression.
4. Confounding Factors and Caveats The most significant caveat is that both variables are almost certainly driven by the same underlying confounder: time. Over the 1970–2023 period, both US employment population and air travel volume grew substantially due to macroeconomic expansion, population growth, technological change, and deregulation — meaning this correlation may largely reflect shared secular trends rather than any meaningful direct relationship between the two. The Granger non-causality result supports this interpretation. Additionally, the dataset labeling appears inverted (air passengers are on the Y-axis but sourced from the employment dataset, and vice versa), suggesting a possible data-joining error that should be verified before drawing any substantive conclusions. Disruptions such as 9/11, the 2008 recession, and COVID-19 may also create structural breaks not visible in the aggregated scatter.
5. Actionable Insights and Further Investigation Given the likely spurious nature of this correlation, the immediate priority should be to verify dataset column assignments and confirm variables are correctly labeled. From an analytical standpoint, researchers should detrend both time series (e.g., via first-differencing or residual analysis against time) to test whether any genuine relationship persists beyond shared temporal growth. Introducing control variables — GDP, fuel prices, population, and major shock indicators (recessions, pandemics) — in a multivariate framework would help isolate true drivers. Finally, extending the Granger causality test across a range of lags (not just the optimal 10) and applying cointegration tests (e.g., Engle-Granger) would clarify whether these series share a meaningful long-run equilibrium or are simply co-trending coincidentally.
X dataset: Our World in Data Air Passengers Carried
Y dataset: US Employment and Unemployment
Part of experiment: Yearly - Our World in Data Air Passengers Carried vs US Employment and Unemployment