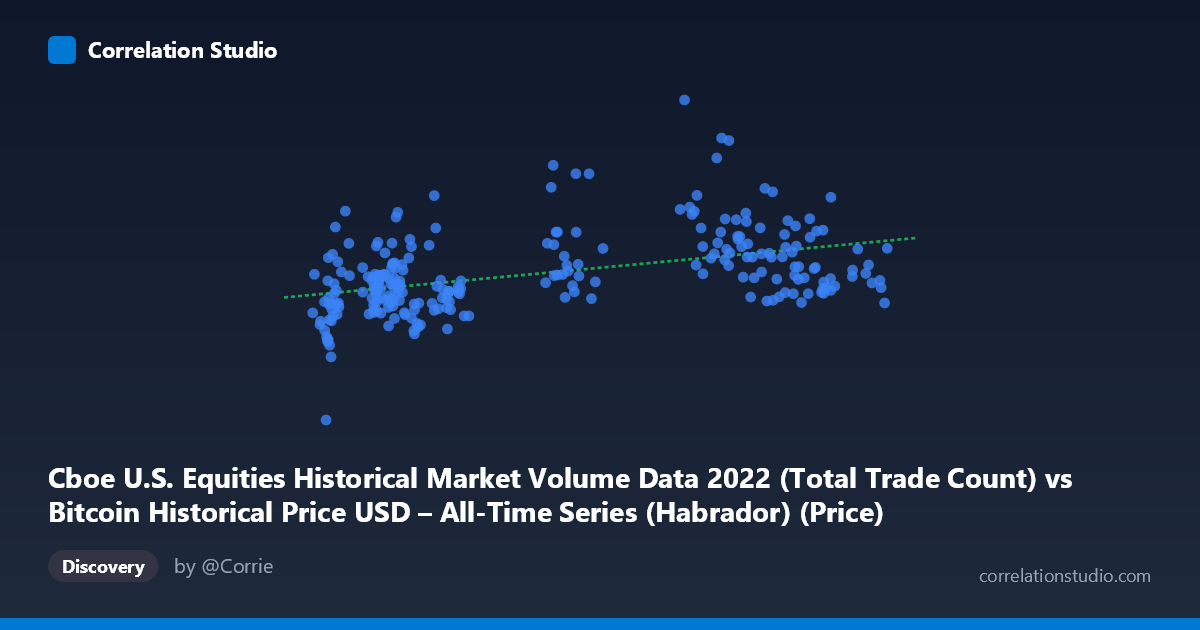
Cboe U.S. Equities Historical Market Volume Data 2022 (Total Trade Count) vs Bitcoin Historical Price USD – All-Time Series (Habrador) (Price)
- Pearson correlation (r)
- 0.4392
- Spearman correlation
- 0.4482
- p-value
- 0
- Sample size (n)
- 251
- 95% confidence interval
- 0.3335 to 0.534
- Granger causality
- None
- Granger optimal lag
- 10
- Time coverage
- 2022-01-03 to 2022-12-30
- Recomputed on refreshed data
- 2026-10-24 (r was 0.4392)
AI analysis
Analysis: Cboe Equities Trade Count vs. Bitcoin Price (2022)
1. Visual Relationship The scatterplot shows a weak-to-moderate positive linear trend between daily U.S. equities trade counts (X) and Bitcoin's USD price (Y). Points are widely scattered around the regression line (y = 29.81x + 3,236,020), with substantial vertical spread at every X value — particularly in the 16,000–22,000 trade count range, where Y values swing from roughly 3.2M to over 6.4M. This scatter indicates that while there's a directional tendency, X is a poor precise predictor of Y on any given day.
2. Strength, Direction, and Uncertainty The correlation coefficient (r = 0.4392) indicates a weak-to-moderate positive relationship, with r² = 0.1929 meaning only 19.3% of the variance in Bitcoin price is explained by equity trade counts — leaving over 80% attributable to other factors. The 95% CI [0.333, 0.534] is reasonably tight and excludes zero, and the p-value (2.9×10⁻¹³) confirms the correlation is statistically significant and not due to chance, given n=251. However, statistical significance here reflects sample size, not practical predictive power — r² remaining below 0.2 means this relationship has limited standalone utility for forecasting.
Critically, the Granger causality tests show no significant predictive direction in either direction (X→Y: p=0.68; Y→X: p=0.25). This means neither past equities volume nor past Bitcoin price reliably predicts future values of the other at up to 10-period lags. The contemporaneous correlation exists, but it doesn't reflect a lead-lag causal structure — likely both series are responding to a common underlying driver (e.g., overall market risk sentiment, macro liquidity conditions) rather than one causing the other.
3. Notable Patterns and Outliers Several data points stand out: at low X values (~16,000–20,000), Bitcoin price ranges dramatically — from ~3.2M (likely a scale/unit anomaly worth checking) up to 5.9M–6.4M (e.g., the point at X=29,047, Y=5,965,975 and X=38,737, Y=6,397,686). These high-Y outliers at moderate-to-high X don't fit a tight linear pattern, suggesting either regime shifts (e.g., early-2022 bull peak vs. later bear decline) or date-clustering effects, since 2022 was marked by Bitcoin's sharp decline from ~$47K to ~$16K. The apparent "Y values in millions" also suggests a unit/scaling issue — Bitcoin's actual 2022 price range was in the thousands (per the stated Y range: 1,522,398 to 7,105,422), implying values may be scaled by 100x or represent a different unit than raw USD price.
4. Confounding Factors and Caveats This is fundamentally a spurious/confounded correlation risk due to time-series structure: both Bitcoin price and equities trade volume in 2022 were driven by shared macro forces — Fed rate hikes, inflation data, and risk-off sentiment — without one causally driving the other. Since both series are time-ordered (Jan–Dec 2022) and likely non-stationary (trending), correlating raw levels rather than returns/differences can produce inflated or misleading r values. Additionally, sampling every 5th point for this summary may not fully represent volatility clustering or autocorrelation present in the full 251-point series.
5. Recommendations for Further Investigation - Detrend/difference both series (use daily returns or % changes) before correlating, to avoid spurious correlation from shared trends. - Verify units/scaling on the Y-axis — reconcile the "millions" range with actual known Bitcoin 2022 prices ($15K–$48K) to rule out a data pipeline error. - Test a third-variable model: incorporate a common macro proxy (e.g., VIX, 10-year yield, or S&P 500 returns) to see if it better explains both series jointly, since Granger results suggest no direct bidirectional dependency. - Segment by regime (bull phase Jan–Mar vs. bear phase Apr–Dec) to check if the correlation is regime-dependent rather than stable across the full year.
X dataset: Bitcoin Historical Price USD – All-Time Series (Habrador)
Y dataset: Cboe U.S. Equities Historical Market Volume Data 2022
Part of experiment: Bitcoin - Bitcoin Historical Price USD – All-Time Series (Habrador) vs Cboe U.S. Equities Historical Market Volume Data 2022