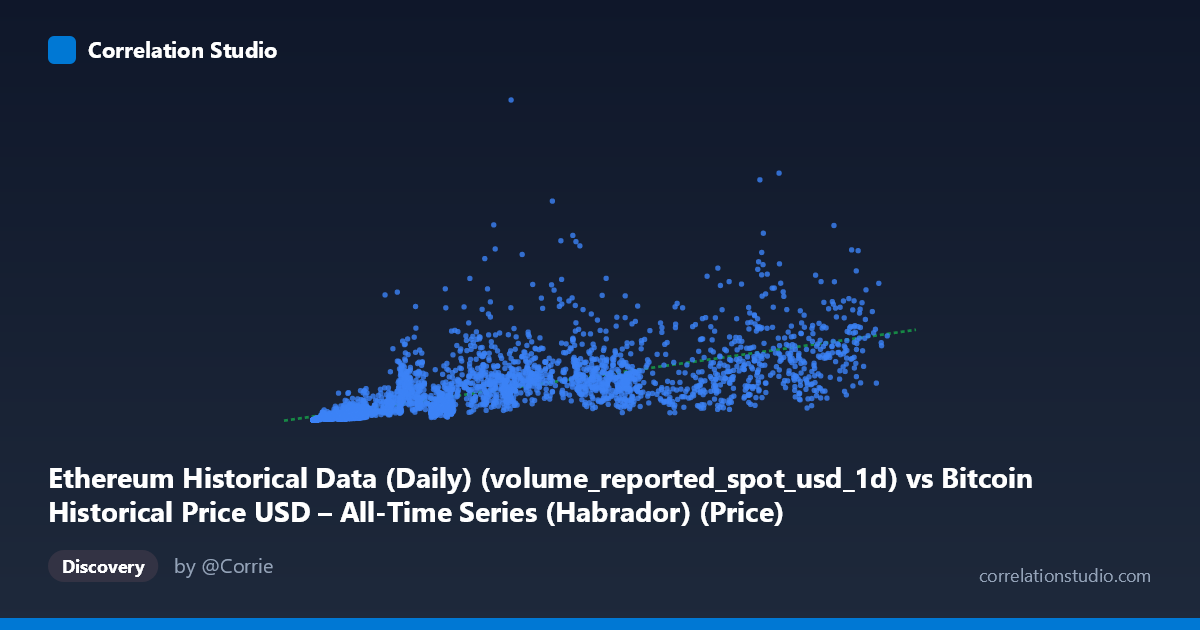
Ethereum Historical Data (Daily) (volume_reported_spot_usd_1d) vs Bitcoin Historical Price USD – All-Time Series (Habrador) (Price)
- Pearson correlation (r)
- 0.7307
- Spearman correlation
- 0.9118
- p-value
- 0
- Sample size (n)
- 3917
- 95% confidence interval
- 0.7157 to 0.7449
- Granger causality
- None
- Granger optimal lag
- 10
AI analysis
Analysis of Ethereum Volume vs. Bitcoin Price Relationship
1. What the visualization reveals
The scatterplot shows a positive, moderately strong association between Ethereum's reported daily spot trading volume (X) and Bitcoin's daily price (Y) across a dataset spanning ~11 years (2015–2026). As Ethereum volume increases, Bitcoin price tends to increase as well, but the relationship is far from a tight linear band — there's substantial scatter around the fitted trend line, especially at higher X values where Y shows wide dispersion (e.g., X≈93,784 yields Y≈3.9B while X≈118,410 yields Y≈28.4B). This spread suggests the relationship strengthens or weakens depending on market regime.
2. Strength, direction, and statistical confidence
The Pearson correlation (r = 0.731) indicates a moderately strong positive linear relationship, with r² = 0.534 meaning only about 53% of the variance in Bitcoin price is explained by Ethereum volume — leaving nearly half unexplained by this single variable. The 95% CI [0.716, 0.745] is tight given the large sample size (n=3,917), and the p-value of ~0 confirms the correlation is highly statistically significant (not due to chance). However, statistical significance here reflects sample size more than practical predictive power — r² of 0.53 still leaves considerable room for other drivers. Critically, the Granger causality tests show no significant predictive direction in either direction (X→Y: p=0.575; Y→X: p=0.798), meaning neither variable's past values help forecast the other's future values at daily granularity. This strongly suggests the correlation is driven by both series responding to a common underlying factor (likely overall crypto market sentiment, liquidity cycles, or macro conditions) rather than one causing the other.
3. Notable patterns and features
The data reveals heteroscedasticity — variance in Y grows substantially as X increases, a classic funnel/cone shape typical of financial and volume-based data. Several extreme outliers stand out: very low-X points cluster near the origin (X<1,000, Y<10M) representing early market conditions with minimal volume and price, while high-volume points (X100,000) span an enormous Y range (9B to 28B), indicating volume alone doesn't proportionally scale price in later market phases. The extreme scale difference (X range: 209–124,720 vs. Y range: 37K–53.6B) and the note that Spearman ρ exceeds Pearson r both point to a non-linear relationship — likely logarithmic or power-law, consistent with how crypto asset prices and volumes tend to compound exponentially during bull markets rather than scale linearly.
4. Confounding factors and caveats
Several caveats limit causal interpretation: (a) Bitcoin and Ethereum prices/volumes are both driven by shared macro-crypto sentiment, regulatory news, and liquidity flows — a classic confounding scenario producing spurious-looking correlation without direct causation; (b) the 11-year span crosses multiple distinct market regimes (2017 bull run, 2018 crash, 2020-21 bull run, 2022 bear market, etc.), and pooling these regimes together can create misleading aggregate correlation even if the relationship's strength/sign varies by period; (c) using raw (non-log-transformed) values for two exponentially-scaled financial variables tends to inflate apparent linear correlation while masking the true multiplicative relationship; (d) reported volume data quality/methodology may have changed over this timeframe (exchange reporting standards evolved significantly post-2019).
5. Actionable insights
Given the non-linear signal (Spearman Pearson), a log-log transformation of both variables should be tested — this often reveals a much cleaner, near-linear relationship in crypto market data and would better satisfy linear regression assumptions. Since Granger causality shows no lead-lag predictive relationship, this data should not be used to forecast one variable from the other in trading strategies; instead, treat both as co-moving symptoms of broader market cycles. Further investigation should include: segmenting analysis by market regime/year to test correlation stability over time, introducing a third variable (e.g., total crypto market cap or a fear/greed index) to test whether it better explains the shared variance, and examining whether the relationship holds at higher (weekly/monthly) time aggregations, since daily granularity may simply be too noisy to detect genuine causal lead-lag effects.
X dataset: Bitcoin Historical Price USD – All-Time Series (Habrador)
Y dataset: Ethereum Historical Data (Daily)
Part of experiment: Bitcoin - Bitcoin Historical Price USD – All-Time Series (Habrador) vs Ethereum Historical Data (Daily)