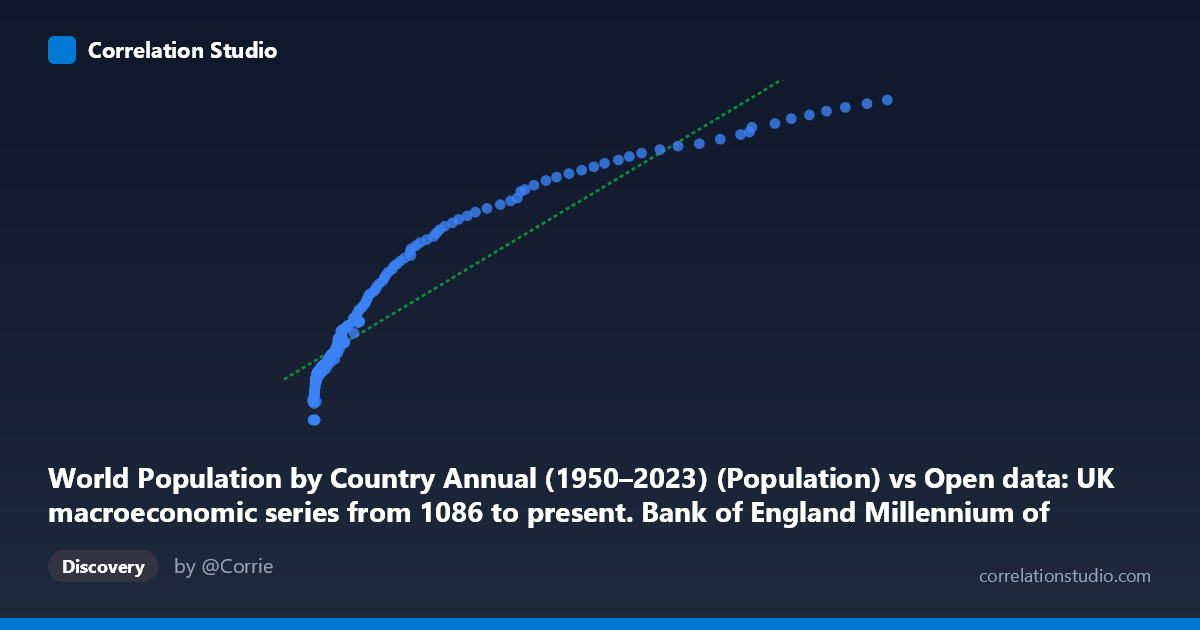
World Population by Country Annual (1950–2023) (Population) vs Open data: UK macroeconomic series from 1086 to present. Bank of England Millennium of Macroeconomic Data. (Year) (value)
- Pearson correlation (r)
- 0.9341
- Spearman correlation
- 0.9963
- p-value
- 0
- Sample size (n)
- 237
- 95% confidence interval
- 0.9157 to 0.9486
- Granger causality
- None
- Granger optimal lag
- 10
- Time coverage
- 1100-01-01 to 2016-01-01
AI analysis
Analysis of World Population vs. UK Macroeconomic Data
1. What the Visualization Reveals
The scatterplot displays a strong positive relationship between world population figures (by country, X-axis) and UK macroeconomic time-series values (Y-axis), spanning a temporal range from 1100 to 2016. The linear regression equation y = 352.374x + 27,455,700 captures the general upward trend, suggesting that as population values increase, the UK macroeconomic metric rises correspondingly. However, this pairing is fundamentally a coincidental temporal correlation — both variables trend upward over time, making time itself the latent driver rather than any direct causal mechanism between world population counts and UK economic aggregates.
2. Correlation Strength, Direction, and Causality
The correlation is strong and positive (r = 0.9341), with R² = 0.8725 indicating that approximately 87.3% of the variance in the UK macroeconomic series is statistically explained by variation in world population figures. The 95% confidence interval for r [0.9157, 0.9486] is narrow and entirely positive, suggesting high precision in the estimate, and the p-value of effectively zero confirms this is not a chance result given n = 237 paired observations. However, the Granger causality analysis critically undermines any causal interpretation: neither direction shows significant predictive power (X→Y: F = 1.03, p = 0.417; Y→X: F = 1.64, p = 0.098), meaning population data does not temporally predict the UK macroeconomic series, nor vice versa. The high correlation without Granger causality is a textbook signal of spurious correlation driven by shared time trends.
3. Notable Patterns, Clusters, and Outliers
The data points reveal a clear concentration at lower X values (below ~50,000), where most observations cluster in a relatively tight band around Y values of 15–55 million, reflecting the bulk of country-level population figures paired with earlier or mid-range UK economic data. Several high-leverage outliers appear at the upper right of the plot — points with X values exceeding 250,000–468,000 (likely large nations such as China, India, or the USA) paired with very high Y values (~124–152 million), which strongly influence the regression slope. There is also a visible non-linear curvature in the relationship: the data does not grow purely linearly, particularly at the extremes, suggesting a power-law or logarithmic relationship might fit better than the current linear model despite its high R².
4. Confounding Factors and Caveats
The most significant caveat is that time is the dominant confound: both world population and UK macroeconomic aggregates (GDP, money supply, debt, wages, etc.) grow over the 20th and 21st centuries, producing an artificially inflated correlation. The dataset mismatch compounds this — the Y-axis draws from a UK-specific macroeconomic series spanning back to 1086, while the X-axis uses country-level population data only from 1950–2023, meaning the temporal overlap and data-generating processes are fundamentally different. The identity of the UK macroeconomic variable is unspecified (it could be nominal GDP, money supply, CPI, etc.), making interpretation ambiguous. Additionally, using every country's population as individual X observations against a single UK time series creates pseudo-replication, inflating the effective sample size and the apparent strength of the relationship.
5. Actionable Insights and Further Investigation
Given the spurious nature of this correlation, the immediate recommendation is to detrend both series (e.g., using first differences or percentage changes) before re-assessing the relationship, which would likely substantially reduce r. Researchers should identify the specific UK macroeconomic variable being used and consider whether a theoretically motivated link exists — for instance, UK trade volumes or immigration flows might plausibly connect to specific country populations. It would be valuable to test subsets: does the correlation hold for UK-specific trading partners only, or for world total population rather than individual countries? Applying co-integration testing (rather than Granger causality alone) would clarify whether these series share a common stochastic trend or are merely parallel trends that diverge under perturbation. Ultimately, this analysis serves as an important reminder that high R² values in macroeconomic time-series comparisons frequently reflect shared secular trends rather than genuine structural relationships.
X dataset: Open data: UK macroeconomic series from 1086 to present. Bank of England Millennium of Macroeconomic Data. (Year)
Y dataset: World Population by Country Annual (1950–2023)
Part of experiment: Yearly - Open data: UK macroeconomic series from 1086 to present. Bank of England Millennium of Macroeconomic Data. (Year) vs World Population by Country Annual (1950–2023)