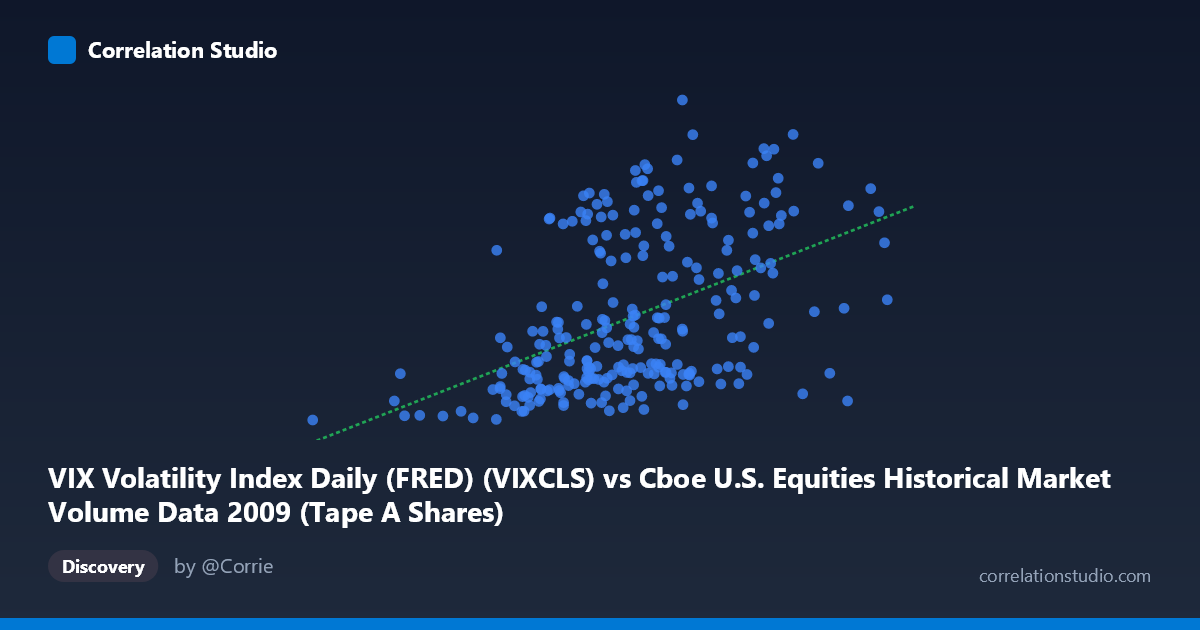
VIX Volatility Index Daily (FRED) (VIXCLS) vs Cboe U.S. Equities Historical Market Volume Data 2009 (Tape A Shares)
- Pearson correlation (r)
- 0.4719
- Spearman correlation
- 0.4983
- p-value
- 0
- Sample size (n)
- 252
- 95% confidence interval
- 0.3699 to 0.5627
- Granger causality
- None
- Granger optimal lag
- 1
AI analysis
Analysis: VIX Volatility Index vs. Cboe U.S. Equities Market Volume (Tape A Shares) — 2009
1. Overall Relationship Revealed
The scatterplot reveals a moderate positive relationship between the VIX Volatility Index and Tape A share volume on U.S. equities exchanges throughout 2009. As VIX values rise — indicating greater implied volatility and market fear — trading volume in Tape A shares tends to increase correspondingly. This is economically intuitive: periods of elevated uncertainty and fear (high VIX) historically drive elevated trading activity as investors rebalance, hedge, or liquidate positions. The linear regression equation (y = 4.37709E-08x + 12.26) confirms a positive slope, meaning that for every billion-unit increase in Tape A share volume, VIX rises by roughly 4.4 points, though the scatter around this line is substantial.
2. Correlation Strength, Direction, and Predictive Value
The Pearson correlation of r = 0.4719 indicates a moderate positive association, but the more revealing statistic is r² = 0.2227, meaning that Tape A share volume explains only approximately 22.3% of the variance in VIX (or vice versa) — leaving nearly 78% of variance unexplained by this linear relationship alone. While the p-value of 2.22E-15 is extraordinarily small, confirming the relationship is highly statistically significant given n = 252 paired observations drawn from a population of N = 3,232, this significance is largely a function of sample size and should not be conflated with practical importance. The 95% confidence interval for r of [0.3699, 0.5627] is moderately wide, suggesting some meaningful uncertainty in the precise strength of the correlation, though the interval firmly excludes zero. Critically, the Granger causality tests reveal no significant predictive directionality in either direction (X→Y: F = 0.41, p = 0.52; Y→X: F = 1.07, p = 0.30), meaning that past values of trading volume do not reliably predict future VIX, and past VIX does not reliably predict future volume at a one-period lag. This is an important caveat: the correlation is contemporaneous in nature, not temporally predictive.
3. Notable Patterns, Clusters, and Outliers
The scatterplot exhibits several visually distinct features. There is a dense central cluster of observations concentrated roughly in the X range of 350–550 million shares and VIX values of 20–35, reflecting the more "normalized" trading environment that emerged in the second half of 2009 as markets recovered from the post-financial-crisis peak. A second, more dispersed cluster appears at higher VIX values (40–56) combined with elevated volume, likely corresponding to the volatile early months of 2009 when the financial crisis was still acute and the S&P 500 hit its cycle low in March. Several notable outliers are visible: the point near (105.7M shares, VIX ~19.47) is the lowest-volume observation and sits isolated at the far left — potentially reflecting a holiday-shortened trading session or data anomaly. Conversely, points like (501.6M shares, VIX ~52.62) and (606.1M shares, VIX ~52.65) represent the high-stress regime. The relationship also appears potentially non-linear, with a possible fan-shaped heteroscedasticity: variance in VIX appears to increase at higher volume levels, suggesting a simple linear model may underfit the true relationship.
4. Confounding Factors and Interpretive Caveats
Several important confounds complicate interpretation. Temporal autocorrelation is likely significant — both VIX and trading volume are highly serially correlated daily time-series, meaning many of the 252 "independent" observations are not truly independent, which inflates statistical significance. The year 2009 is an extraordinary and non-representative period — spanning the tail end of the global financial crisis, the March 2009 market bottom, and a historic bull market recovery — making findings from this year unlikely to generalize to normal market conditions. The X and Y axis labels appear transposed in the dataset metadata (VIX is listed as the X variable but described under the Y-axis dataset label), warranting careful verification of which variable is truly being treated as predictor vs. outcome. Additionally, common drivers such as macroeconomic news releases, Federal Reserve interventions, earnings seasons, and global risk events likely drive both VIX and volume simultaneously, creating spurious correlation through shared causation rather than a direct link between the two variables.
5. Actionable Insights and Further Investigation
Despite the moderate correlation and absence of Granger causality, this relationship warrants deeper investigation along several axes. Regime-based segmentation — splitting the data into pre- and post-March 2009 crisis periods — would likely reveal that the correlation is substantially stronger during the high-volatility crisis regime than during the recovery, which would be actionable for volatility-targeting trading strategies. Researchers should test non-linear specifications (e.g., log-log transformation, polynomial regression, or a spline model) given the apparent heteroscedasticity, as the relationship between fear and volume may be exponential rather than linear during tail-risk events. Multivariate modeling incorporating variables such as S&P 500 returns, bid-ask spreads, and options market open interest would help isolate the independent contribution of volume to VIX. Finally, extending the analysis across multiple years (particularly including 2008, 2010, and calmer periods like 2013–2014) would allow for a robust test of whether this moderate correlation is a structural feature of U.S. equity markets or an artifact of the unique 2009 crisis environment.
X dataset: Cboe U.S. Equities Historical Market Volume Data 2009
Y dataset: VIX Volatility Index Daily (FRED)
Part of experiment: Daily - Cboe U.S. Equities Historical Market Volume Data 2009 vs VIX Volatility Index Daily (FRED)