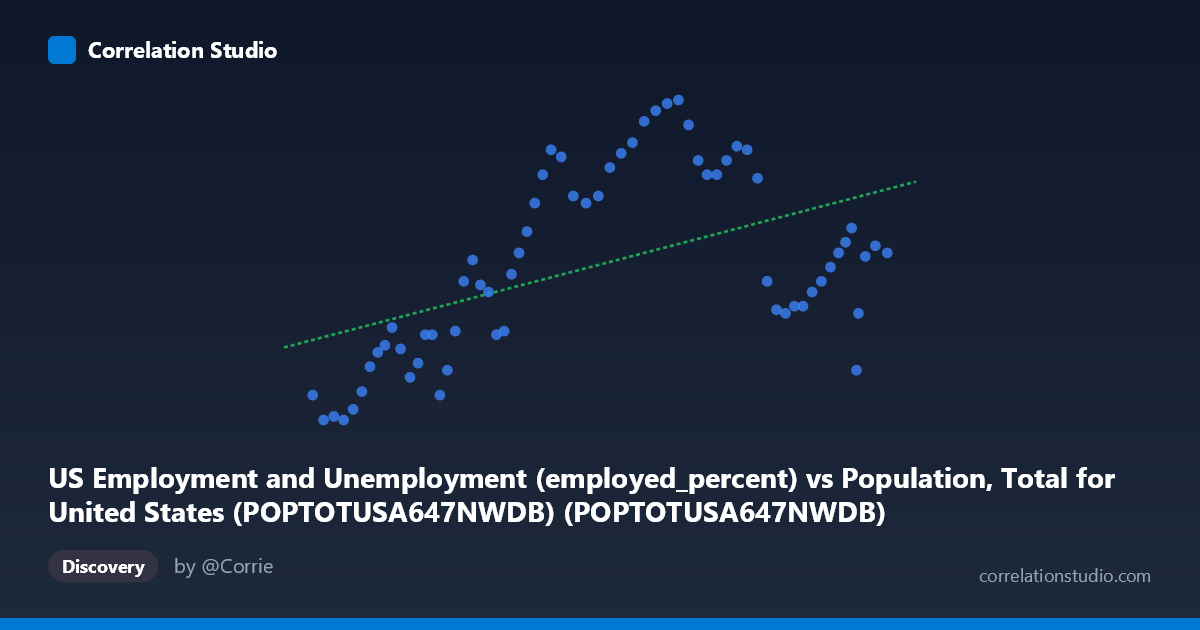
US Employment and Unemployment (employed_percent) vs Population, Total for United States (POPTOTUSA647NWDB) (POPTOTUSA647NWDB)
- Pearson correlation (r)
- 0.5002
- Spearman correlation
- 0.5382
- p-value
- 0.000022
- Sample size (n)
- 65
- 95% confidence interval
- 0.2919 to 0.6632
- Granger causality
- None
- Granger optimal lag
- 1
- Time coverage
- 1960-01-01 to 2024-01-01
AI analysis
Scatterplot Analysis: US Population vs. Employment Percentage
Overview of the Relationship
The scatterplot reveals a moderate positive association between total US population (X-axis) and the employed percentage of the labor force (Y-axis), spanning annual observations from 1960 to 2024. As population has grown from roughly 181 million to 340 million, the employment percentage has generally trended upward from the mid-50s to the low-60s percent range. However, the scatter around the regression line is substantial, and the relationship is clearly not a clean monotonic progression — there are notable clusters and reversals that suggest the two variables move together only loosely and are likely both being driven by broader structural forces rather than one another directly.
Correlation Strength, Direction, and Statistical Framing
The Pearson correlation of r = 0.50 indicates a moderate positive relationship, but the more telling statistic is r² = 0.25, meaning that US population size explains only about 25% of the variance in employment percentage — leaving 75% of the variation unexplained by this model alone. The 95% confidence interval for r spans [0.29, 0.66], which is reasonably wide and reflects meaningful uncertainty about the true population-level relationship; while the lower bound confirms a real positive association, the upper bound falls well short of a strong correlation. The p-value of 2.2 × 10⁻⁵ confirms the correlation is highly statistically significant given n = 65, so the association is unlikely to be a chance artifact. Critically, however, the Granger causality tests show no significant predictive directionality in either direction (X→Y: F = 0.04, p = 0.85; Y→X: F = 1.61, p = 0.21). This means that knowing population size in one year does not help predict employment rate in the next year beyond what is already known, and vice versa — strongly cautioning against any causal interpretation.
Notable Patterns, Clusters, and Outliers
The scatterplot displays several distinct behavioral clusters rather than a smooth continuum. At lower population values (roughly 180–230 million, corresponding to the 1960s–1970s), employment percentages cluster tightly in the 55–60% range. A middle cluster around 240–285 million population shows a broader spread but generally higher employment rates, frequently reaching 61–64%. Points in the 290–340 million range (roughly 2000s–2020s) show conspicuous scatter and reversals: several high-population observations fall back to 58–61%, likely corresponding to the 2008–2009 financial crisis and the 2020 COVID-19 disruption. One notable potential outlier is the observation near (279M, 64.3%), which sits at the high end of employment for its population level, and (331.6M, 56.8%) — a very high-population point with a surprisingly low employment rate — almost certainly reflecting the pandemic labor market collapse of 2020.
Confounding Factors and Interpretive Caveats
The most important caveat here is that both variables are primarily driven by time — they are both time-indexed annual series that trend upward over decades, making their correlation largely a shared time trend rather than a direct mechanistic relationship. This is a classic spurious correlation via common temporal confounding: population grows almost monotonically, while employment percentage reflects complex cyclical economic dynamics (recessions, demographic shifts, women's labor force entry in the 1970s–80s, aging baby boomers, and pandemic shocks). The denominator of the employment rate itself partly depends on population through the labor force participation rate, introducing a mathematical dependency. Additionally, the linear regression model (y = 2.66×10⁻⁸x + 52.85) imposes a linearity assumption that the cluster structure in the data does not fully support — particularly the plateauing and reversal at high population values.
Actionable Insights and Further Investigation
Given that 75% of employment rate variance is unexplained and Granger causality is absent, population size should not be used as a forecasting tool for employment rates. More productive analyses would include: (1) detrending both series (e.g., first-differencing or removing a common time trend) to test whether any relationship persists beyond shared temporal drift; (2) incorporating GDP, Federal Reserve policy cycles, and major economic shocks as covariates to model employment rate more robustly; (3) segmenting the data by economic regime (expansion vs. recession periods) to examine whether the population–employment relationship differs structurally across business cycles; and (4) exploring labor force participation rate as a more nuanced denominator that separates demographic from economic drivers. The 2020 outlier point in particular warrants flagging or separate treatment in any predictive model.
X dataset: Population, Total for United States (POPTOTUSA647NWDB)
Y dataset: US Employment and Unemployment
Part of experiment: Yearly - Population, Total for United States (POPTOTUSA647NWDB) vs US Employment and Unemployment