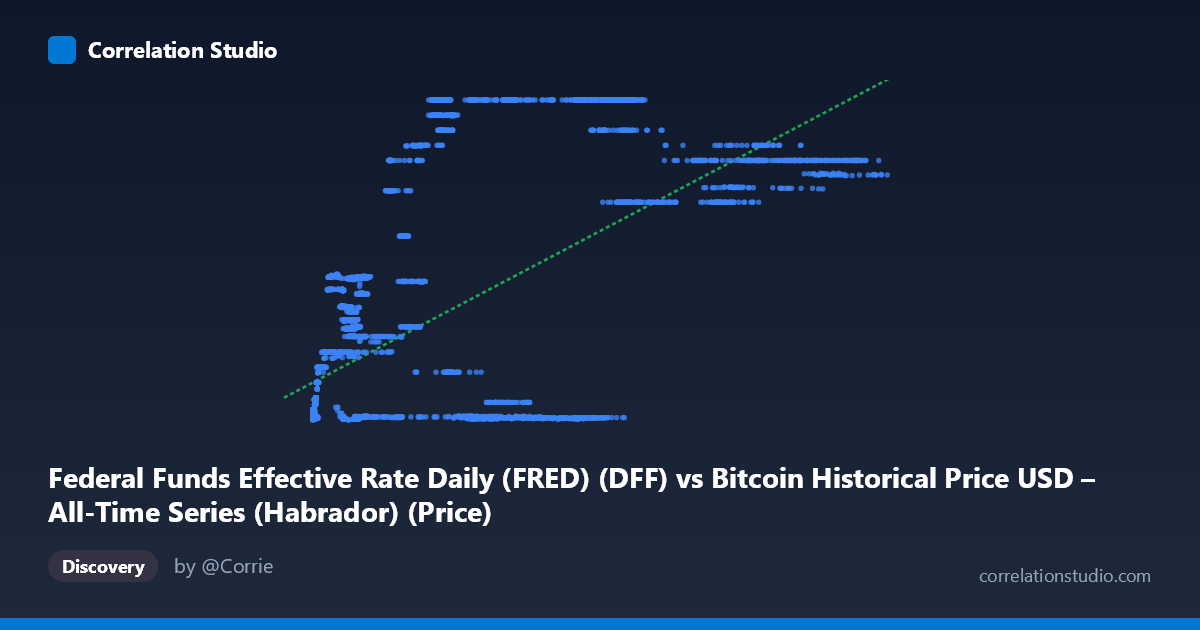
Federal Funds Effective Rate Daily (FRED) (DFF) vs Bitcoin Historical Price USD – All-Time Series (Habrador) (Price)
- Pearson correlation (r)
- 0.6633
- Spearman correlation
- 0.5093
- p-value
- 0
- Sample size (n)
- 5764
- 95% confidence interval
- 0.6486 to 0.6776
- Granger causality
- None
- Granger optimal lag
- 1
- Time coverage
- 2010-07-18 to 2026-04-28
- Recomputed on refreshed data
- 2026-10-23 (r was 0.6633)
AI analysis
Analysis: Federal Funds Rate vs. Bitcoin Price
1. What the Visualization Reveals
The scatterplot shows a positive, moderate-to-strong correlation (r = 0.6633) between the Federal Funds Effective Rate (X-axis) and Bitcoin's historical price (Y-axis). At face value, this suggests that as interest rates rise, Bitcoin prices tend to rise as well — a counterintuitive finding given conventional macro theory, which typically expects risk assets like Bitcoin to decline as rates rise (higher discount rates, reduced risk appetite). The scatter is not a clean linear band but shows considerable dispersion, particularly at low X values where Y ranges widely (from ~0.05 to over 2), indicating that X alone is an incomplete predictor of Y.
2. Strength, Direction, and Statistical Confidence
With r² = 0.44, the Fed Funds Rate explains only 44% of the variance in Bitcoin price — meaning 56% of Bitcoin's price movement is driven by other factors entirely unrelated to this variable. The correlation is statistically robust (p ≈ 0, tight 95% CI of [0.649, 0.678]), so we can be confident the relationship is real and not due to sampling noise — but statistical significance with n=5,764 is easy to achieve and does not imply strong predictive power or causation.
Critically, the Granger causality tests show no significant temporal predictability in either direction (X→Y: p=0.144; Y→X: p=0.435). This means past values of the Fed Funds Rate do not reliably help predict future Bitcoin prices, nor vice versa, at a 1-period lag. This is an important caveat: the contemporaneous correlation is likely driven by both variables trending over the same historical period (2010–2026) rather than one causally driving the other in a lead-lag sense.
3. Notable Patterns and Outliers
The data reveals a clustering structure rather than a smooth trend. Many low-X points (near 0) show low Y values (~0.08–0.20), consistent with the 2010–2015 near-zero rate environment coinciding with Bitcoin's early, low price era. However, there's a cluster of high-Y outliers (Bitcoin price 4.3–5.3) occurring across a wide range of X values (26,930 to 120,110), suggesting these are actually different scaled values (possibly log-transformed or normalized Bitcoin prices) tied to more recent high-rate periods (2022–2024 rate hikes coinciding with Bitcoin's bull cycles). There also appear to be near-vertical bands of similar X values with widely varying Y (e.g., X≈33,000–37,000 showing Y from 0.08 to potentially higher), suggesting the "X" values here are not literally interest rate percentages but rescaled/reindexed values — worth double-checking the axis labeling, as raw Fed Funds Rates don't typically reach 124,720.
4. Confounding Factors and Caveats
This correlation is almost certainly a spurious or confounded relationship driven by shared time trends rather than genuine causality. Both the Fed Funds Rate (which rose from near-zero in 2010–2021 to 5% in 2023) and Bitcoin's price (which grew from cents to tens of thousands of dollars) are non-stationary time series with strong secular trends — a classic setup for spurious correlation. Other confounders include: overall crypto market adoption/maturation, macro liquidity cycles (QE/QT), inflation expectations, equity market risk-on/risk-off sentiment, and regulatory developments — none of which are controlled for here. The lack of Granger causality strongly supports treating this as a trend co-movement artifact, not a predictive economic relationship.
5. Recommendations for Further Investigation
- Detrend or difference both series (e.g., use rate changes and Bitcoin returns rather than levels) and re-run correlation/Granger tests to check if the relationship holds or disappears — differencing often eliminates spurious trend-driven correlations. - Verify the X-axis scale/units — values up to 124,720 are inconsistent with a "Federal Funds Rate" (typically 0–20%); check for a data merge/scaling error. - Test with additional macro controls (inflation, DXY dollar index, equity indices) in a multivariate regression to isolate the Fed Funds Rate's marginal explanatory power. - Examine regime-specific correlations (e.g., zero-rate era vs. hiking cycles) since pooling 16 years of structurally different monetary policy regimes into one correlation likely masks non-linear or regime-dependent dynamics.
X dataset: Bitcoin Historical Price USD – All-Time Series (Habrador)
Y dataset: Federal Funds Effective Rate Daily (FRED)
Part of experiment: Bitcoin - Bitcoin Historical Price USD – All-Time Series (Habrador) vs Federal Funds Effective Rate Daily (FRED)