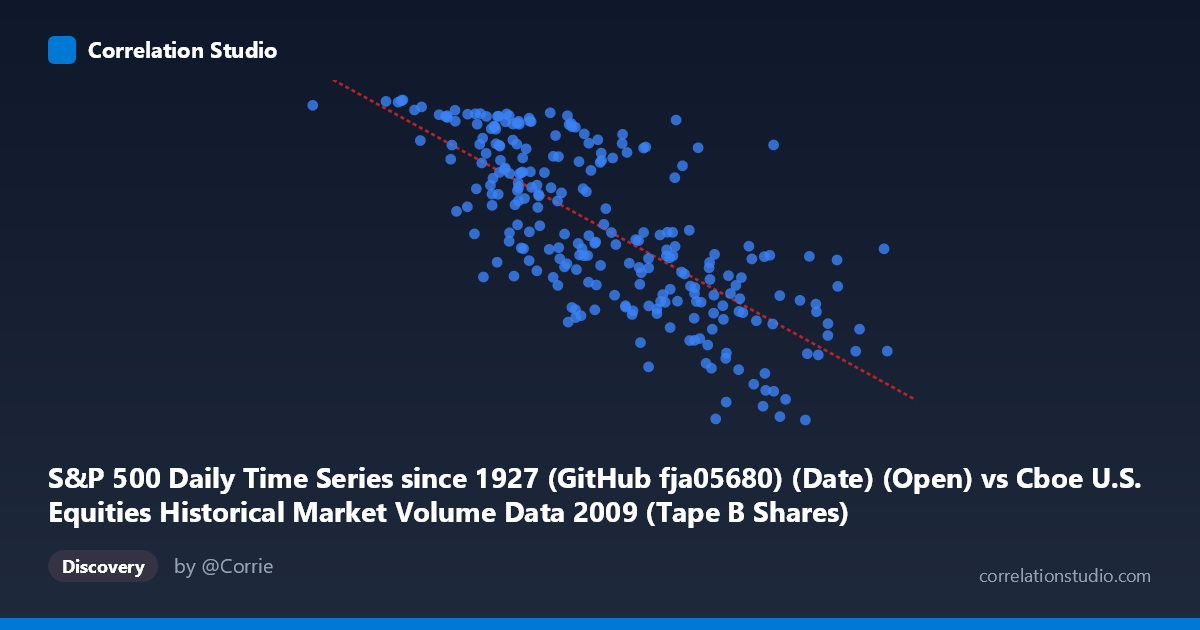
S&P 500 Daily Time Series since 1927 (GitHub fja05680) (Date) (Open) vs Cboe U.S. Equities Historical Market Volume Data 2009 (Tape B Shares)
- Pearson correlation (r)
- -0.7407
- Spearman correlation
- -0.7496
- p-value
- 0
- Sample size (n)
- 252
- 95% confidence interval
- -0.7918 to -0.6793
- Granger causality
- Bidirectional
- Granger optimal lag
- 4
AI analysis
Analysis: S&P 500 Open Price vs. Cboe Tape B Share Volume (2009)
Relationship Overview The scatterplot reveals a clear negative relationship between the S&P 500 daily open price (X-axis) and Cboe Tape B share volume (Y-axis) across 2009. As the S&P 500 opened at higher price levels, Tape B share volume tended to be lower, and conversely, during the market's distressed lows early in 2009, trading volume in Tape B securities was markedly elevated. The linear regression equation y = -1.997×10⁻⁶x + 1240.3 quantifies this inverse relationship, indicating that for every 10-million-unit increase in the S&P 500 open price, Tape B shares volume decreases by approximately 20 units. This pattern is consistent with well-documented "fear-driven" trading behavior, where market stress and lower equity valuations coincide with heightened trading activity.
Correlation Strength and Statistical Significance The Pearson correlation of r = -0.741 represents a moderately strong negative association, and the R² of 0.549 means that roughly 54.9% of the variance in Tape B share volume is explained by the S&P 500 open price alone — a substantial explanatory share for a single-variable model in financial data. The 95% confidence interval of [-0.792, -0.679] is notably narrow given the sample size of n = 252, and the p-value of essentially zero confirms this relationship is highly unlikely to be a chance artifact. The population-level N of 3,232 further reinforces the robustness of this finding beyond the sampled points. Critically, the Granger causality results indicate bidirectional predictive influence at an optimal lag of 4 trading periods: S&P 500 open prices Granger-cause Tape B volume (F = 4.15, p = 0.003), and Tape B volume Granger-causes S&P 500 prices (F = 4.80, p = 0.001). This bidirectionality suggests a feedback loop — price movements predict future volume shifts, and volume surges carry information about future price direction — rather than a clean unidirectional causal story.
Notable Patterns and Outliers Several features stand out in the data. The sample points show considerable vertical scatter at mid-range X values (roughly 110M–175M), suggesting heteroscedasticity — the relationship is noisier at moderate price levels than at the extremes. At the low end of the X range, the point (33,822,027, 1121.08) is a notable outlier representing the early 2009 market bottom, with both unusually low prices and very high volume, consistent with the panic selling of February–March 2009. At the high end, (254,504,133, 919.58) and (255,752,989) represent the year-end rally, where volume had moderated substantially. A cluster of points near Y ≈ 670–780 paired with X values above 190M suggests that as the market recovered into Q4 2009, Tape B volume compressed to multi-year lows, potentially reflecting rotation away from small/mid-cap Tape B names toward large-caps.
Confounding Factors and Caveats Several important caveats limit causal interpretation. First, 2009 is a structurally unusual year — it encompasses one of the most severe market crashes in modern history followed by a sharp recovery, meaning the correlation may be largely driven by this single macro regime transition rather than a stable ongoing relationship. Second, the X-axis variable is labeled as Date (Open) mapped to a numerical range, which suggests X may encode a date ordinal or timestamp rather than a pure price level — this would mean the correlation is partly capturing a time trend (early year = low prices = high fear volume; late year = higher prices = lower volume). Third, Tape B specifically covers NYSE American and regional exchange securities, so volume dynamics may reflect sector-specific factors (small/mid-cap stress) rather than broad market sentiment. Finally, the Granger causality, while statistically significant, reflects predictability rather than true economic causation, and the 4-period lag (~4 trading days) could be sensitive to model specification.
Actionable Insights and Further Investigation Practitioners and researchers should consider several follow-up analyses. First, decomposing the time series into the crisis period (Jan–March 2009) and recovery period (April–December 2009) separately would test whether the correlation holds in both regimes or is entirely crisis-driven. Second, incorporating VIX or credit spreads as covariates would help disentangle whether the volume–price relationship is mediated by volatility/fear rather than price level per se. Third, the bidirectional Granger causality at lag 4 warrants exploration as a potential short-term trading signal — volume spikes in Tape B may contain predictive information about S&P 500 direction 4 days forward. Finally, extending this analysis across multiple years (2008, 2010, 2011) would determine whether this ~55% explanatory relationship is a durable structural feature of equity microstructure or an artifact of one extraordinary year.
X dataset: Cboe U.S. Equities Historical Market Volume Data 2009
Y dataset: S&P 500 Daily Time Series since 1927 (GitHub fja05680) (Date)
Part of experiment: Daily - Cboe U.S. Equities Historical Market Volume Data 2009 vs S&P 500 Daily Time Series since 1927 (GitHub fja05680) (Date)