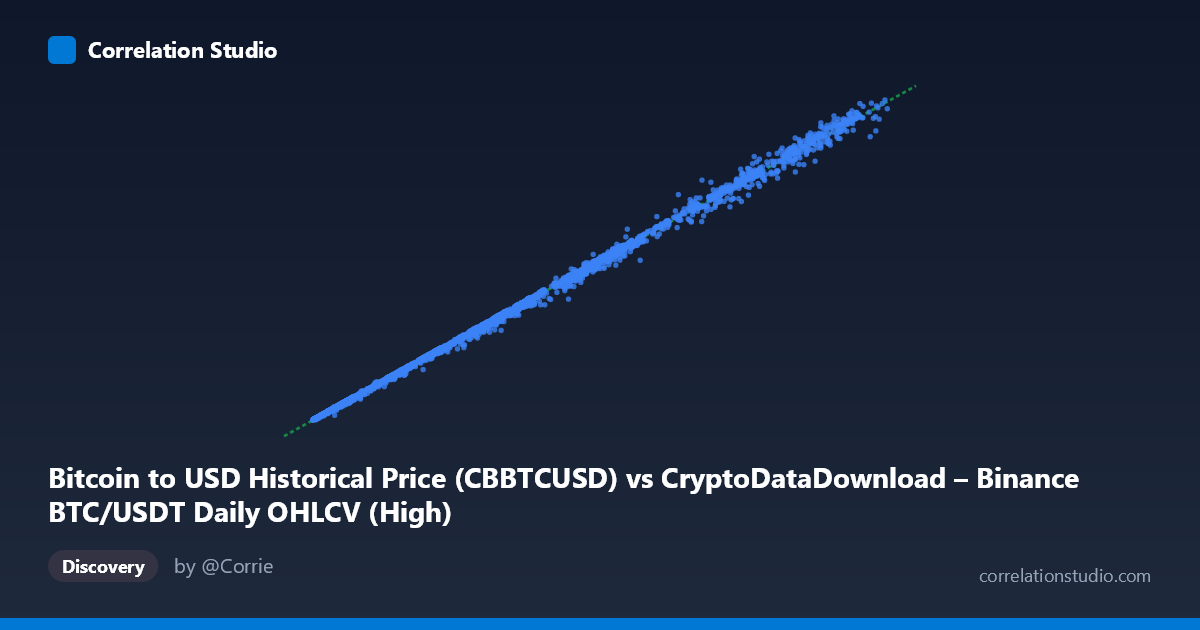
Bitcoin to USD Historical Price (CBBTCUSD) vs CryptoDataDownload – Binance BTC/USDT Daily OHLCV (High)
- Pearson correlation (r)
- 0.9993
- Spearman correlation
- 0.9995
- p-value
- 0
- Sample size (n)
- 3211
- 95% confidence interval
- 0.9993 to 0.9994
- Granger causality
- None
- Granger optimal lag
- 10
- Time coverage
- 2017-08-17 to 2026-06-25
- Recomputed on refreshed data
- 2026-10-24 (r was 0.9993)
AI analysis
Analysis: BTC/USDT (Binance) vs BTC/USD (Coinbase) Price Series
1. Relationship Overview The scatterplot depicts an almost perfectly linear relationship between two Bitcoin price series drawn from different exchanges (Binance vs. Coinbase) over roughly nine years of daily data. Points hug a straight line running from near the origin through the full price range (~$3,200 to ~$126,000), with no visible curvature, fanning, or regime breaks. This is the expected signature of two data feeds tracking the same underlying asset rather than two genuinely distinct variables.
2. Strength, Direction, and Predictive Structure The correlation is essentially as strong as empirical data gets: r = 0.9993, r² = 0.9987, meaning over 99.8% of the variance in Coinbase's BTC price is explained by Binance's BTC price (and vice versa). The tight 95% CI [0.9993, 0.9994] and p ≈ 0 confirm this isn't sampling noise — with n = 3,211 daily observations, the relationship is both extremely strong and extremely precisely estimated. The regression slope (0.984) and near-zero intercept (−139.96) indicate the two series are nearly 1:1, with Coinbase prices running very slightly below Binance on average.
Critically, the Granger causality test shows no significant lead-lag relationship in either direction (X→Y: p=0.23; Y→X: p=0.22) at the optimal 10-lag window. This is an important nuance: despite the near-perfect contemporaneous correlation, neither series meaningfully predicts the other's future movements beyond what's already reflected simultaneously. In other words, the two exchanges move together in lockstep — price discovery happens essentially simultaneously across markets, consistent with efficient, arbitrage-linked crypto markets rather than one exchange leading the other.
3. Patterns and Features The scatter is remarkably homogeneous — no distinct clusters, no visible outlier clouds, and no evidence of decoupling during specific price regimes (bull runs near $120K or troughs near $3.5K behave identically to mid-range prices). The sample points show minor, consistent Binance-slightly-above-Coinbase spread (e.g., 101351 vs 97324; 71419 vs 68350), suggesting a small, fairly constant basis/premium rather than a level-dependent divergence. No non-linear curvature or heteroskedastic fanning is apparent even at extreme values, meaning the relationship holds with similar tightness at both low and high prices.
4. Caveats and Confounders This is not a "relationship between two independent variables" in the traditional sense — it's essentially the same asset priced on two exchanges, so near-unity correlation is expected/mechanical rather than a novel empirical finding. Key caveats: (a) both series can share identical data-vendor artifacts (stale ticks, gaps, or synchronized outages) that inflate apparent agreement; (b) daily OHLCV aggregation can mask intraday lead-lag dynamics that a daily-frequency Granger test cannot detect — true price discovery leadership may exist at minute/hour granularity; (c) the ~9-year window spans vastly different volatility regimes, yet a single linear fit is applied throughout, potentially masking time-varying basis or slippage during high-volatility events (e.g., flash crashes, exchange outages).
5. Suggested Next Steps Given the near-identity relationship, further work should shift from "is there a correlation" toward basis/spread analysis: examine the residuals (Coinbase − predicted Binance) over time to detect arbitrage opportunities, exchange-specific liquidity premiums, or stress-period divergences (e.g., during exchange-specific outages or regulatory news). Re-run Granger causality at higher frequency (hourly/minute) data, where genuine price-leadership effects between exchanges are more likely to surface. Finally, consider whether the intercept (−139.96) reflects a persistent structural discount on Coinbase relative to Binance, which could be practically relevant for cross-exchange arbitrage or execution routing strategies.
X dataset: CryptoDataDownload – Binance BTC/USDT Daily OHLCV
Y dataset: Bitcoin to USD Historical Price
Part of experiment: Bitcoin - CryptoDataDownload – Binance BTC/USDT Daily OHLCV vs Bitcoin to USD Historical Price