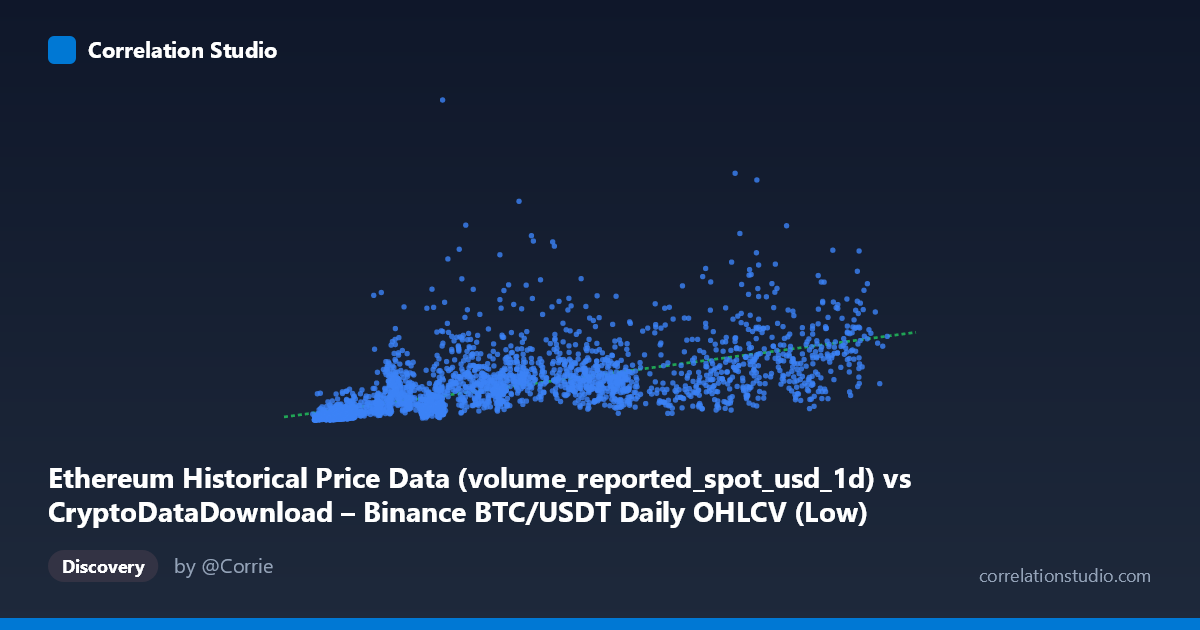
Ethereum Historical Price Data (volume_reported_spot_usd_1d) vs CryptoDataDownload – Binance BTC/USDT Daily OHLCV (Low)
- Pearson correlation (r)
- 0.6618
- Spearman correlation
- 0.8358
- p-value
- 0
- Sample size (n)
- 3191
- 95% confidence interval
- 0.6419 to 0.6809
- Granger causality
- Y → X
- Granger optimal lag
- 10
AI analysis
Analysis: BTC/USDT Volume vs. Ethereum Price Relationship
1. What the Visualization Reveals
The scatterplot depicts a moderate positive relationship between reported trading volume (labeled X, though metadata suggests some column-mapping ambiguity between BTC volume and ETH price fields) and a monetary value metric (Y, in the billions range). As X increases from roughly 2,800 to 123,000 units, Y generally trends upward from ~$100M to over $50B, but with substantial scatter at every level of X — particularly in the low-to-mid X range (5,000–30,000), where Y values span nearly two orders of magnitude (from ~$200M to over $14B). This heteroscedastic fan-shaped pattern is a strong visual signal that the relationship is not a clean linear one.
2. Strength, Direction, and Uncertainty
The Pearson correlation (r = 0.662) indicates a moderate-to-strong positive linear association, but r² = 0.438 tells the more important practical story: only 43.8% of the variance in Y is explained by X, leaving over half unexplained by this single variable. The 95% CI [0.642, 0.681] is tight, and p ≈ 0 confirms this correlation is highly statistically reliable given the large sample (n=3,191) — we can be confident a real, non-zero relationship exists. However, statistical significance here reflects sample size more than practical predictive strength; r² remains the more honest measure of real-world explanatory power. The Granger causality results add a temporal dimension: Y Granger-causes X (F=2.44, p=0.0067) with a 10-period optimal lag, while X does not significantly predict Y (p=0.238). This suggests past values of Y carry modest predictive information about future X, but not vice versa — consistent with a market where price/volume dynamics in one asset (ETH-related metrics) lead rather than follow the other (BTC volume).
3. Notable Patterns and Outliers
Several features stand out in the sample data: a cluster of low-X, low-Y points (X<10,000, Y<$1B) represents a coherent, tight subgroup — likely early-period or low-activity days. Conversely, there are notable outliers where low-to-mid X values correspond to disproportionately high Y (e.g., X≈35,440 with Y≈$14.6B, or X≈77,460 with Y≈$19B) — these likely represent volatility spikes or specific market events decoupled from typical volume-price scaling. The wide vertical spread at mid-range X (40,000–80,000) suggests at least two behavioral regimes: a "normal" band tracking the regression line and a secondary set of elevated-Y outliers. The Spearman ρ exceeding Pearson r explicitly confirms curvature — the relationship likely follows a logarithmic or power-law pattern rather than a straight line, common in financial volume/price data with multiplicative rather than additive scaling.
4. Confounding Factors and Caveats
Major caveats apply here. First, the metadata is internally inconsistent — the X-axis is labeled as Ethereum volume data but described as a BTC/USDT column, and Y is labeled as "Low" price but described as Ethereum data; this cross-referencing ambiguity make substantive interpretation risky until the schema is clarified. Second, both series span 2017–2026, a period encompassing multiple bull/bear cycles, exchange listings changes, and structural market shifts (DeFi summer, FTX collapse, ETF approvals) — these regime changes act as confounders that inflate apparent correlation without reflecting a stable causal mechanism. Third, BTC and ETH prices/volumes are both driven by shared macro crypto-market sentiment, so any correlation between cross-asset metrics may reflect this common factor rather than a direct link.
5. Actionable Insights
Given the log-scale hint from Spearman/Pearson divergence, refitting with a log-log or power-law model should meaningfully improve fit over the current linear R²=0.438. The Granger result — Y leading X at a 10-period lag — merits deeper investigation via a lagged regression or VAR model to quantify the predictive relationship's magnitude and stability out-of-sample. Before drawing further conclusions, clarify and correct the column/dataset labeling to ensure X and Y represent what's intended. Finally, segmenting the data by market regime (bull/bear/sideways) or by year could isolate whether the correlation is stable over time or driven by a handful of extreme-volatility periods, which the outliers suggest may be the case.
X dataset: CryptoDataDownload – Binance BTC/USDT Daily OHLCV
Y dataset: Ethereum Historical Price Data
Part of experiment: Bitcoin - CryptoDataDownload – Binance BTC/USDT Daily OHLCV vs Ethereum Historical Price Data