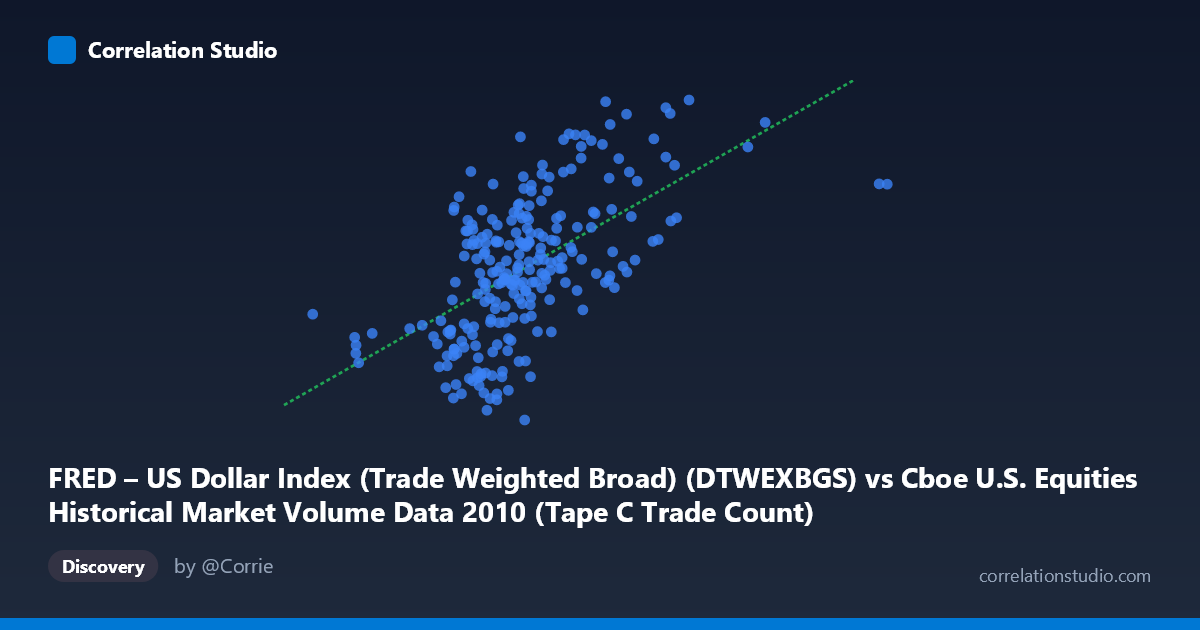
FRED – US Dollar Index (Trade Weighted Broad) (DTWEXBGS) vs Cboe U.S. Equities Historical Market Volume Data 2010 (Tape C Trade Count)
- Pearson correlation (r)
- 0.5826
- Spearman correlation
- 0.5854
- p-value
- 0
- Sample size (n)
- 245
- 95% confidence interval
- 0.4933 to 0.6598
- Granger causality
- None
- Granger optimal lag
- 1
AI analysis
Analysis: US Dollar Index vs. Cboe Tape C Trade Count (2010)
Relationship Overview
The scatterplot reveals a moderate positive relationship between the Trade Weighted Broad US Dollar Index (X-axis) and the Cboe Tape C Trade Count (Y-axis) across 245 daily paired observations spanning the full calendar year 2010. As the dollar index rises, Tape C trade counts tend to increase, suggesting that periods of dollar strength coincide with elevated trading activity on Cboe's Tape C (NYSE Arca-listed securities). The linear regression equation (y = 7.27×10⁻⁶x + 88.56) confirms this positive slope, though the relatively small coefficient reflects the scale difference between the two variables. The relationship is broadly upward-trending but with considerable dispersion around the regression line, immediately signaling that the association, while real, is far from deterministic.
Correlation Strength and Statistical Framing
The Pearson correlation of r = 0.583 reflects a moderate positive association, but the more telling figure is R² = 0.339 — meaning only 33.9% of the variance in Tape C trade counts is explained by the dollar index. Roughly two-thirds of the variation in trading activity is driven by factors entirely outside this model. The 95% confidence interval for r of [0.493, 0.660] is comfortably above zero and reasonably tight given the sample size (n = 245), and the p-value of effectively zero confirms this correlation is statistically distinguishable from chance at any conventional threshold. However, statistical significance here is partly a function of the large underlying population (N = 3,302), so practical significance deserves separate scrutiny. Critically, the Granger causality tests reveal no significant predictive temporal direction: X→Y yields F = 0.48 (p = 0.489), and Y→X yields F = 3.85 (p = 0.051) — the latter approaching but not crossing the conventional 0.05 threshold. This means the dollar index does not reliably predict next-period trade counts, and trade counts marginally (but not significantly at α = 0.05) hint at predicting the dollar index. Neither variable meaningfully drives the other in time, suggesting the observed correlation is likely contemporaneous and possibly spurious or driven by shared external forces.
Patterns, Clusters, and Outliers
Several structural features are visible in the data. The bulk of observations cluster in the X range of roughly 450,000–800,000 and Y range of 90–95, forming a dense central cloud where the positive trend is most apparent. There is a notable thin right tail at very high X values (approaching 1,379,287), where trade counts do not scale proportionally — for instance, the point near (1,379,287, 95.30) sits well below what the linear trend might predict for that X value, suggesting diminishing returns or a different regime at extreme dollar index readings. On the high-Y end, several points cluster around Y = 97–97.55 (e.g., near X = 788,000–964,000), which appear to represent a ceiling or compressed range for trade counts. A few low-X, mid-Y points (e.g., near X = 261,608, Y = 91.20) stand apart from the main cluster, potentially representing anomalous low-volume days or early-year market conditions. The scatter fan appears to widen slightly at higher X values, hinting at mild heteroscedasticity.
Confounding Factors and Interpretive Caveats
Several important caveats apply. First, 2010 was a distinctive macroeconomic year — post-financial crisis recovery, Federal Reserve quantitative easing, the European sovereign debt crisis, and the May 6 Flash Crash all created co-movements in both currency markets and equity trading volumes that may be entirely coincidental in their correlation. Both variables could be jointly responding to risk-off/risk-on market regimes: when global uncertainty rises, investors may simultaneously flee to the dollar (strengthening the index) and trade more actively (raising trade counts), creating a spurious correlation mediated by investor sentiment. Second, the axes may be swapped from their natural roles — the dataset labels suggest X is actually a volume/notional measure from Cboe data and Y is the dollar index, or vice versa; careful verification of variable assignment is warranted. Third, Tape C specifically captures NYSE Arca securities, which skews toward ETFs — dollar-sensitive ETF arbitrage activity could legitimately link these variables, but this would require a more targeted mechanism hypothesis. Fourth, the linear model assumes stationarity, yet both financial time series are likely non-stationary over a calendar year, making OLS assumptions suspect without differencing or cointegration testing.
Actionable Insights and Further Investigation
Despite the absence of Granger causality, the contemporaneous correlation is strong enough to warrant further investigation rather than dismissal. Analysts should first test for cointegration between the two series using Engle-Granger or Johansen methods, which would determine whether they share a long-run equilibrium relationship even without short-run predictive power. Second, controlling for VIX or broader risk appetite measures would help disentangle whether the dollar-volume correlation survives after accounting for market stress regimes — a segmented regression by high/low VIX periods would be particularly informative. Third, given the marginal Y→X Granger result (p = 0.051), extending the lag window beyond 1 period or testing over a longer multi-year dataset might reveal latent predictive relationships that are obscured by 2010's specific dynamics. Finally, decomposing Tape C trade counts by ETF vs. equity could isolate whether currency-hedged or dollar-sensitive ETF products are the mechanical channel driving this association, turning a statistical observation into an actionable trading or risk management signal.
X dataset: Cboe U.S. Equities Historical Market Volume Data 2010
Y dataset: FRED – US Dollar Index (Trade Weighted Broad)
Part of experiment: Daily - Cboe U.S. Equities Historical Market Volume Data 2010 vs FRED – US Dollar Index (Trade Weighted Broad)