World Bank CO2 Emissions by Country (DataBank) (Bunker fuels (Not in Total)) vs US Measles cases and deaths historical (Measles deaths)
- Pearson correlation (r)
- -0.5658
- Spearman correlation
- -0.9228
- p-value
- 0
- Sample size (n)
- 92
- 95% confidence interval
- -0.6906 to -0.4083
- Granger causality
- None
- Granger optimal lag
- 10
- Time coverage
- 1919-01-01 to 2020-01-01
- Recomputed on refreshed data
- 2026-10-17 (r was -0.5658)
AI analysis
Analysis: Bunker Fuel CO2 Emissions vs. US Measles Deaths (1919–2020)
1. What the Visualization Reveals
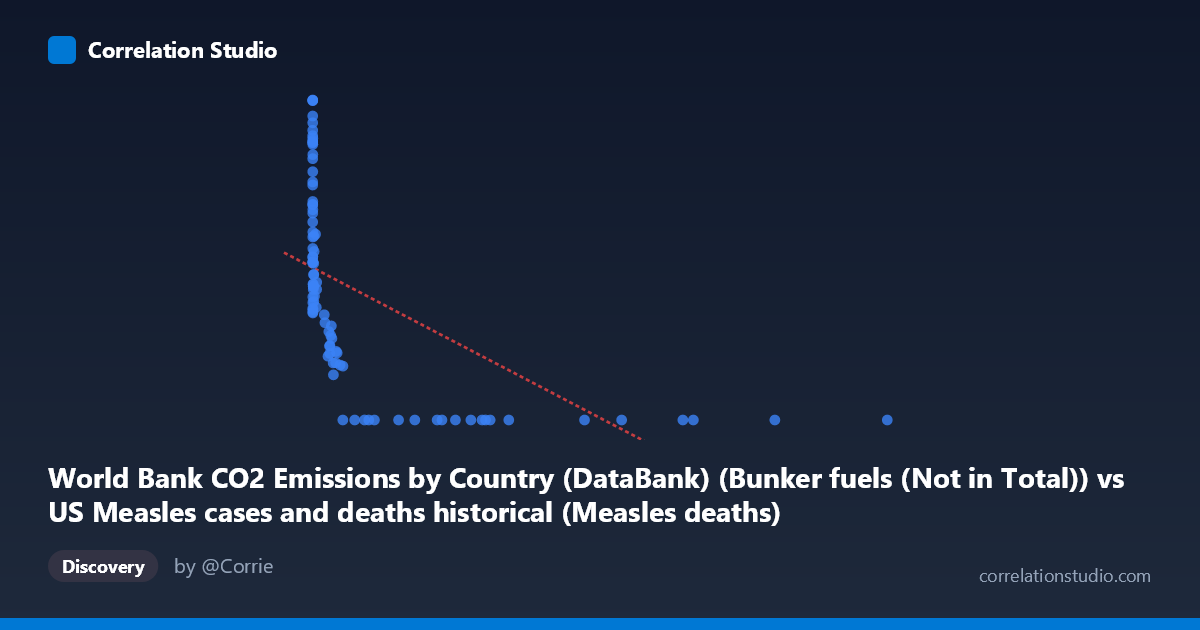
The scatterplot displays a negative relationship between global bunker fuel CO2 emissions and US measles deaths across roughly a century of annual observations. The most visually striking feature is a pronounced L-shaped or hyperbolic distribution: many data points cluster along the Y-axis (near-zero X values paired with high measles death counts), while a separate cluster of points occupies the X-axis (high emission values paired with near-zero deaths). This pattern immediately signals that the relationship is almost certainly non-linear and driven by shared temporal trends rather than any direct mechanistic link between the two variables.
2. Correlation Strength, Direction, and Causality
The Pearson correlation of r = −0.5658 indicates a moderate negative association, with r² = 0.3202 meaning that roughly 32% of the variance in measles deaths is statistically "explained" by bunker fuel emissions. While this is non-trivial in magnitude, the confidence interval [−0.69, −0.41] and the highly significant p-value (4.2 × 10⁻⁹) confirm the correlation is reliably non-zero in the population. However, statistical significance here is largely a reflection of sample size and the strength of a shared temporal trend, not a meaningful physical relationship. Critically, the Granger causality tests find no significant predictive directionality in either direction (X→Y: p = 0.478; Y→X: p = 0.894), meaning neither variable's past values help forecast the other's future values beyond what each already contains. This is an important brake on any causal interpretation.
3. Notable Patterns, Clusters, and Non-Linearity
The data form two visually distinct clusters that account for the L-shape: (a) early-to-mid 20th century observations with low bunker emissions and substantial measles mortality, and (b) post-vaccination era observations with high bunker emissions and near-zero measles deaths. There are notable outliers at extreme X values (e.g., 12,992 units of bunker emissions with 0 deaths) and extreme Y values (e.g., deaths of ~1,590 at near-zero emissions). The note that Spearman ρ exceeds Pearson r confirms a non-linear structure; a logarithmic or step-function model would likely fit substantially better than the linear regression (y = −0.115x + 757.78), which struggles to accommodate the floor effects at both axes.
4. Confounding Factors and Interpretive Caveats
This correlation is a near-textbook example of spurious correlation driven by a shared temporal trend. Both variables are monotonically time-indexed: measles deaths declined steeply following the 1963 measles vaccine introduction, while bunker fuel emissions rose continuously through industrialization and globalization. The real driver of the measles decline is vaccine coverage and public health infrastructure, not emissions. Additional confounders include changes in disease surveillance and reporting standards, shifts in population size, improvements in general medical care, and post-WWII economic expansion affecting both variables simultaneously. The dataset labels also appear cross-joined between datasets (measles deaths labeled under CO2 dataset and vice versa), warranting careful verification of the data pipeline before drawing any conclusions.
5. Actionable Insights and Further Investigation
The primary actionable insight is methodological: detrend both time series before computing correlations (e.g., using first differences, residuals from a time trend, or ARIMA pre-whitening) to remove the confounding influence of shared secular trends. Researchers should also test non-linear model fits (logarithmic or piecewise/segmented regression) given the L-shaped distribution and the Spearman Pearson signal. A more productive investigative path would be to correlate measles deaths directly with vaccine coverage rates, healthcare expenditure, or public health policy milestones, which carry genuine mechanistic relevance. If the bunker emissions variable is of independent interest, it should be analyzed against outcomes with plausible causal pathways, such as respiratory disease incidence or climate-linked health metrics.
X dataset: US Measles cases and deaths historical
Y dataset: World Bank CO2 Emissions by Country (DataBank)
Part of experiment: Yearly - US Measles cases and deaths historical vs World Bank CO2 Emissions by Country (DataBank)