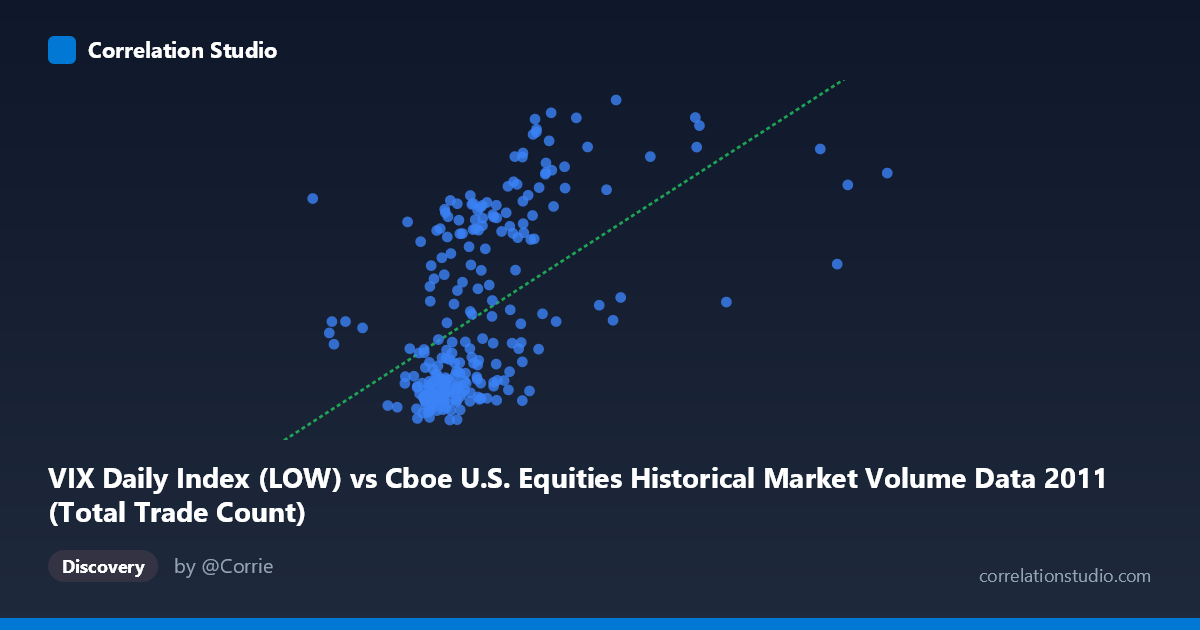
VIX Daily Index (LOW) vs Cboe U.S. Equities Historical Market Volume Data 2011 (Total Trade Count)
- Pearson correlation (r)
- 0.5372
- Spearman correlation
- 0.5994
- p-value
- 0
- Sample size (n)
- 252
- 95% confidence interval
- 0.443 to 0.6196
- Granger causality
- None
- Granger optimal lag
- 1
AI analysis
Analysis: VIX Low vs. Total Trade Count (2011)
Relationship Overview The scatterplot reveals a moderate positive relationship between the VIX Daily Index Low values and the total trade count in U.S. equities markets during 2011. As the VIX low rises — indicating elevated baseline volatility — total trade count tends to increase as well. This is intuitive: periods of heightened market uncertainty typically drive greater trading activity as participants reposition, hedge, or react to news. The linear regression equation (y = 7.61×10⁻⁶x + 7.75) confirms this upward slope, though the wide scatter around the regression line signals that the relationship is far from deterministic.
Correlation Strength and Statistical Framing The Pearson correlation of r = 0.537 indicates a moderate positive association, but the r² of 0.289 is the more sobering figure — only 28.9% of the variance in total trade count is explained by VIX low values, meaning roughly 71% of trade count variation is driven by other factors entirely. The 95% confidence interval of [0.443, 0.620] is meaningfully above zero and relatively tight given n = 252, and the p-value of ~0 confirms this is not a chance finding in the sample. However, the Granger causality results are notably null — neither direction (X→Y: F = 0.112, p = 0.738; Y→X: F = 0.122, p = 0.727) approaches significance at any conventional threshold. This means that while the two variables move together contemporaneously, neither one temporally predicts the other at a one-period lag. The correlation reflects co-movement, not a lead-lag predictive structure.
Notable Patterns, Clusters, and Outliers The data visibly clusters into two broad regimes. A dense low-volatility cluster sits below approximately VIX Low = 20 and trade count < ~22, representing the calmer stretches of 2011. A second, more dispersed high-volatility cluster spans VIX lows from roughly 25–45 with trade counts reaching up to ~40, corresponding to the European sovereign debt crisis and U.S. debt ceiling turbulence in mid-to-late 2011. Several apparent outliers sit at extreme VIX low values (35) with very high trade counts — likely the acute stress days of August 2011. There is also a visible gap between the two clusters, suggesting the market transitioned relatively sharply between regimes rather than moving continuously, which hints at a bimodal or regime-switching dynamic rather than a clean linear one.
Confounding Factors and Caveats Several important caveats apply. First, market structure changes — such as algorithmic trading bursts, exchange-specific rule changes, or TRF reporting quirks — could independently inflate trade counts irrespective of volatility. Second, the VIX Low is only one facet of daily volatility; using VIX Close or the daily VIX range might yield different relationships. Third, seasonality (e.g., lower summer volumes, year-end effects) likely contributes to both variables simultaneously, acting as a hidden confounder that inflates the observed correlation. Fourth, the axes appear swapped in the dataset labeling (VIX data housed under the equities file and vice versa), which warrants verification of source alignment before drawing firm conclusions. Finally, with N = 3,780 as the population but only n = 252 sampled, the sample captures roughly one-fifteenth of trading days, and the sampling interval (every 5th point) could introduce mild autocorrelation bias.
Actionable Insights and Further Investigation Given the regime-switching appearance of the data, a threshold or piecewise regression (e.g., splitting at VIX Low = 20) would likely outperform the single linear model and better characterize each market environment. Researchers should test for structural breaks around the August 2011 volatility spike specifically. Incorporating additional covariates — such as VIX range (high minus low), S&P 500 daily return, or day-of-week effects — into a multivariate model could substantially improve explained variance beyond the current 28.9%. Since Granger causality finds no predictive directionality at lag 1, longer lags or intraday data might reveal whether volatility anticipates volume spikes at finer time scales. Finally, replicating this analysis across other years would clarify whether the 2011 relationship is structurally stable or an artifact of that year's unique macro stress environment.
X dataset: Cboe U.S. Equities Historical Market Volume Data 2011
Y dataset: VIX Daily Index
Part of experiment: Daily - Cboe U.S. Equities Historical Market Volume Data 2011 vs VIX Daily Index