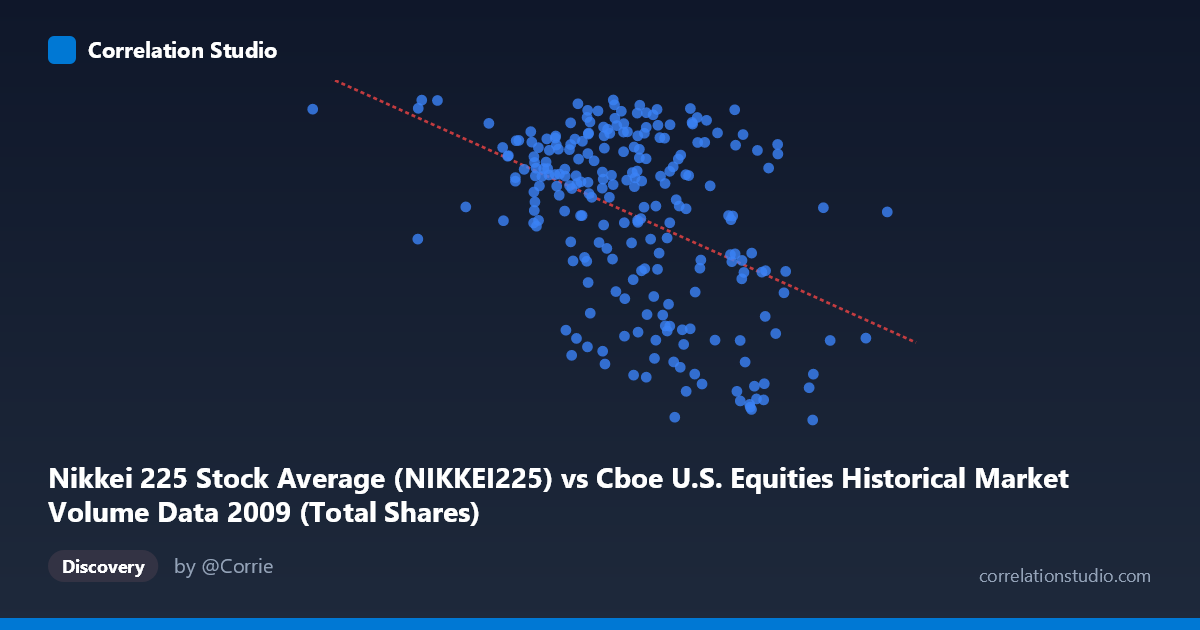
Nikkei 225 Stock Average (NIKKEI225) vs Cboe U.S. Equities Historical Market Volume Data 2009 (Total Shares)
- Pearson correlation (r)
- -0.447
- Spearman correlation
- -0.3811
- p-value
- 0
- Sample size (n)
- 235
- 95% confidence interval
- -0.5438 to -0.3384
- Granger causality
- None
- Granger optimal lag
- 10
AI analysis
Analysis: Nikkei 225 vs. U.S. Equity Market Volume (2009)
Relationship Overview
The scatterplot reveals a moderate negative relationship between the Nikkei 225 daily closing price (X-axis) and U.S. equity total share volume (Y-axis) across 2009. The linear regression equation (y = -2.847×10⁻⁶x + 11,519.9) confirms that as the Nikkei 225 index level rises, U.S. equity trading volume tends to decline. This inverse pattern is intuitively interesting: higher Japanese equity valuations coinciding with lower U.S. trading activity could suggest that periods of market calm and recovery (rising Nikkei) correspond with reduced urgency or fear-driven trading in U.S. markets. The spread of points across the plot is nonetheless considerable, indicating that many individual trading days deviate substantially from this general trend.
Correlation Strength and Statistical Significance
The correlation coefficient of r = -0.447 represents a moderate negative association, but the explanatory power is notably limited — r² = 0.1998 means only ~20% of the variance in U.S. share volume is explained by the Nikkei 225 level. The remaining 80% of variability is attributable to other factors entirely. The 95% confidence interval of [-0.544, -0.338] is meaningfully negative throughout and does not cross zero, and the p-value of 6.075×10⁻¹³ confirms this relationship is highly statistically significant given the sample of n=235 drawn from a population of N=3,232. However, statistical significance here is partly a function of sample size and should not be conflated with practical or economic significance. Critically, Granger causality testing finds no significant predictive direction in either direction (X→Y: F=1.24, p=0.267; Y→X: F=1.42, p=0.175), meaning neither variable reliably predicts future values of the other at the optimal 10-period lag. The correlation, while real, appears to be contemporaneous and coincidental rather than directionally causal.
Notable Patterns and Outliers
The scatterplot shows a broadly elliptical cloud with a downward tilt, consistent with the negative correlation, but with substantial vertical scatter — particularly in the middle X range (~700M–900M Nikkei values), where Y-values span the full range from approximately 7,400 to 10,600. Several potential outliers are visible: points like (993,061,661, 7,280) and (855,413,033, 7,376) sit at the lower-right periphery with unusually low volume despite mid-to-high Nikkei levels, while points like (773,037,929, 10,581) and (862,862,948, 10,544) show high volume despite elevated Nikkei levels. There is also a noticeable cluster of high-volume observations at moderate Nikkei levels (~600M–800M range), which likely corresponds to the volatile early-2009 market period following the financial crisis, when fear and uncertainty drove elevated trading activity. The distribution does not appear strongly non-linear, though a slight heteroscedastic widening of the scatter in the mid-range is evident.
Confounding Factors and Caveats
Several important caveats limit causal interpretation. 2009 was a highly anomalous year — spanning the tail of the global financial crisis (January–March lows) and a dramatic recovery rally (March–December), meaning both variables were simultaneously influenced by the same macro shock (the GFC), which is a classic confounding driver producing spurious correlation. The Nikkei 225 is denominated in Japanese Yen and reflects Japanese corporate earnings expectations, while U.S. equity volume reflects domestic trading behavior across all U.S. exchanges — these are structurally different measures (a price index vs. a volume count). Furthermore, day-of-week effects, earnings seasons, index rebalancing events, and U.S.-specific policy announcements (e.g., TARP, Fed actions) could drive volume independently of Japanese market levels. The absence of Granger causality reinforces that any observed correlation is likely driven by a shared latent variable — global risk sentiment — rather than a direct mechanistic link.
Actionable Insights and Further Investigation
Given that global risk sentiment is the most plausible shared driver, a productive next step would be to introduce a risk proxy — such as the VIX (CBOE Volatility Index) — as a control variable to test whether the Nikkei–volume correlation disappears after accounting for fear/uncertainty levels. A multiple regression or partial correlation analysis including VIX, S&P 500 returns, and USD/JPY exchange rates would clarify how much independent explanatory power the Nikkei 225 carries. It would also be valuable to segment the analysis by crisis vs. recovery phases (pre- and post-March 2009 market bottom) to determine whether the correlation is consistent across regimes or driven entirely by the crisis period. Finally, extending this analysis to multiple years (2007–2012) would test whether the 2009 relationship is structural or purely crisis-specific — a finding with significant implications for cross-market hedging and portfolio risk management strategies.
X dataset: Cboe U.S. Equities Historical Market Volume Data 2009
Y dataset: Nikkei 225 Stock Average
Part of experiment: Daily - Cboe U.S. Equities Historical Market Volume Data 2009 vs Nikkei 225 Stock Average