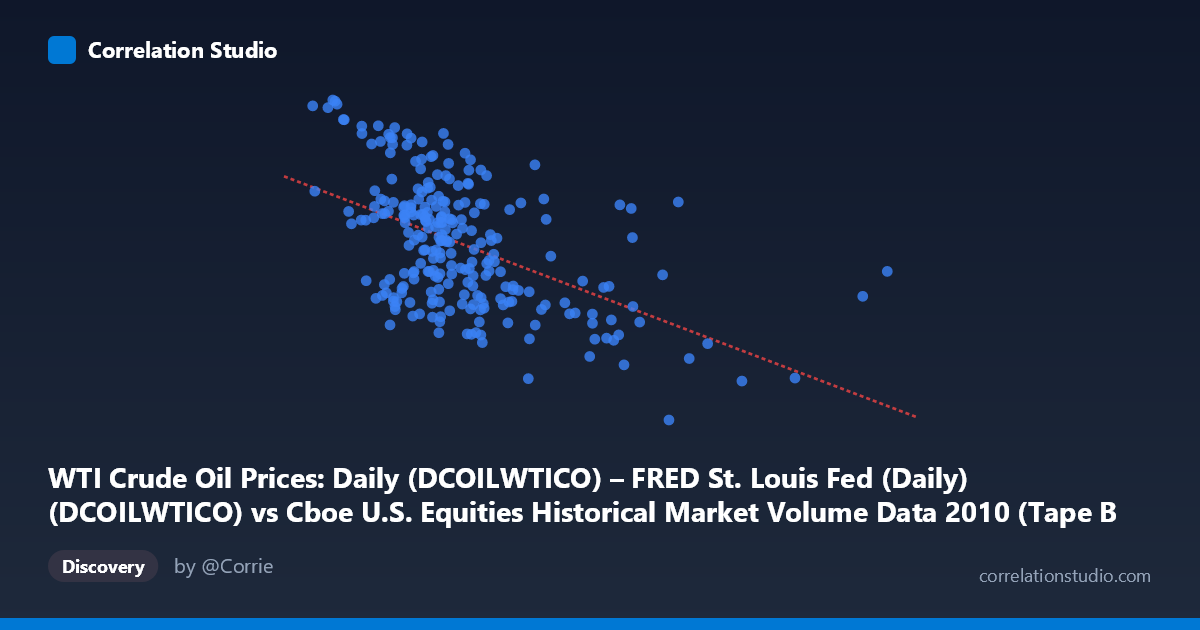
WTI Crude Oil Prices: Daily (DCOILWTICO) – FRED St. Louis Fed (Daily) (DCOILWTICO) vs Cboe U.S. Equities Historical Market Volume Data 2010 (Tape B Shares)
- Pearson correlation (r)
- -0.5143
- Spearman correlation
- -0.485
- p-value
- 0
- Sample size (n)
- 252
- 95% confidence interval
- -0.5998 to -0.4173
- Granger causality
- None
- Granger optimal lag
- 1
AI analysis
Analysis: WTI Crude Oil Prices vs. Cboe Tape B Share Volume (2010)
Relationship Overview The scatterplot reveals a moderate negative relationship between WTI crude oil prices (X-axis) and Cboe Tape B share volume (Y-axis) across 252 trading days in 2010. As oil prices rise, Tape B equity share volume tends to decline, and the linear regression equation (y = -6.27e-08x + 86.55) quantifies this downward slope. Visually, the data points show a discernible but noisy downward trend, with considerable scatter around the regression line, suggesting that while the relationship is real, it is far from deterministic. The spread is particularly wide in the mid-range of oil prices (roughly $80–$110/barrel), indicating that many other forces are simultaneously driving equity trading volume.
Correlation Strength and Statistical Significance The Pearson correlation of r = -0.514 indicates a moderate negative association, but the more practically meaningful statistic is R² = 0.2645, meaning oil prices explain only about 26.5% of the variance in Tape B share volume. Over 73% of the variation remains unexplained by this single predictor. The 95% confidence interval of [-0.600, -0.417] is entirely negative and reasonably tight, confirming directional reliability, and the p-value of essentially 0 (given N = 3,302 population context and n = 252 sample) firmly rules out chance. However, statistical significance here should not be confused with practical explanatory power — the relationship is real but incomplete. Critically, the Granger causality tests show no significant predictive directionality: oil prices do not significantly Granger-cause Tape B volume (F = 1.03, p = 0.31), and the reverse direction (volume → oil prices) approaches but does not cross the significance threshold (F = 3.52, p = 0.062). This suggests the two variables move together contemporaneously rather than one reliably leading the other in time.
Notable Patterns, Clusters, and Outliers Several features stand out in the sample points. There is a visible cluster of high Tape B volume values (85–91) concentrated at lower oil price levels (roughly $45M–$90M range on the X-axis), consistent with the negative correlation. Conversely, the lowest volume readings (64–72) tend to appear at higher oil price levels (above $150M–$320M X-range). A few notable outliers deserve attention: the point near (316 million, 75.10) sits far to the right of the main data cloud, representing an extreme oil price day with moderate volume — a potential high-leverage point that could be disproportionately influencing the regression slope. Similarly, (218 million, 64.78) and (255 million, 68.03) represent the lowest volume observations paired with elevated prices. The distribution of X values appears right-skewed (mean ~113M vs. a maximum of ~329M), which may violate linear regression assumptions and warrant a log transformation.
Confounding Factors and Caveats Several important caveats temper interpretation. First, 2010 was a distinctive year — markets were recovering from the 2008–2009 financial crisis, and both oil prices and equity volumes were influenced by macro factors including Fed quantitative easing, European sovereign debt concerns, and the Deepwater Horizon oil spill. Any of these events could drive the observed co-movement spuriously. Second, Tape B share volume (covering NYSE American/AMEX-listed securities) is a relatively narrow slice of total market activity, and its behavior may reflect sector-specific dynamics rather than broad market responses to oil. Third, the axes appear to be mislabeled or swapped in the dataset metadata — WTI oil prices in USD/barrel should not reach values of 37 million to 328 million; these appear to be raw index or scaled values, and Tape B "shares" in units of 65–91 are unusually low, suggesting possible normalization or unit inconsistency that requires verification. Fourth, seasonality — both oil prices and equity volumes exhibit intra-year patterns that could generate spurious correlation.
Actionable Insights and Further Investigation Practitioners should treat this correlation cautiously as a signal worth investigating, not a trading rule. The absence of Granger causality means neither series reliably leads the other, limiting tactical use for prediction. Recommended next steps include: (1) verify data units and axis assignments to ensure the variables are correctly mapped and scaled; (2) apply log transformation to the X variable to address right skew and potentially improve linearity; (3) control for confounding macro variables (VIX, S&P 500 returns, Fed funds rate) in a multivariate regression to isolate the oil-volume relationship; (4) segment by time period within 2010 to test whether the correlation strengthens during specific macro events like the oil spill (April–July); and (5) extend the analysis to multiple years to determine whether 2010 represents an anomalous period or a persistent structural relationship between energy prices and equity market microstructure activity.
X dataset: Cboe U.S. Equities Historical Market Volume Data 2010
Y dataset: WTI Crude Oil Prices: Daily (DCOILWTICO) – FRED St. Louis Fed (Daily)
Part of experiment: Daily - Cboe U.S. Equities Historical Market Volume Data 2010 vs WTI Crude Oil Prices: Daily (DCOILWTICO) – FRED St. Louis Fed (Daily)