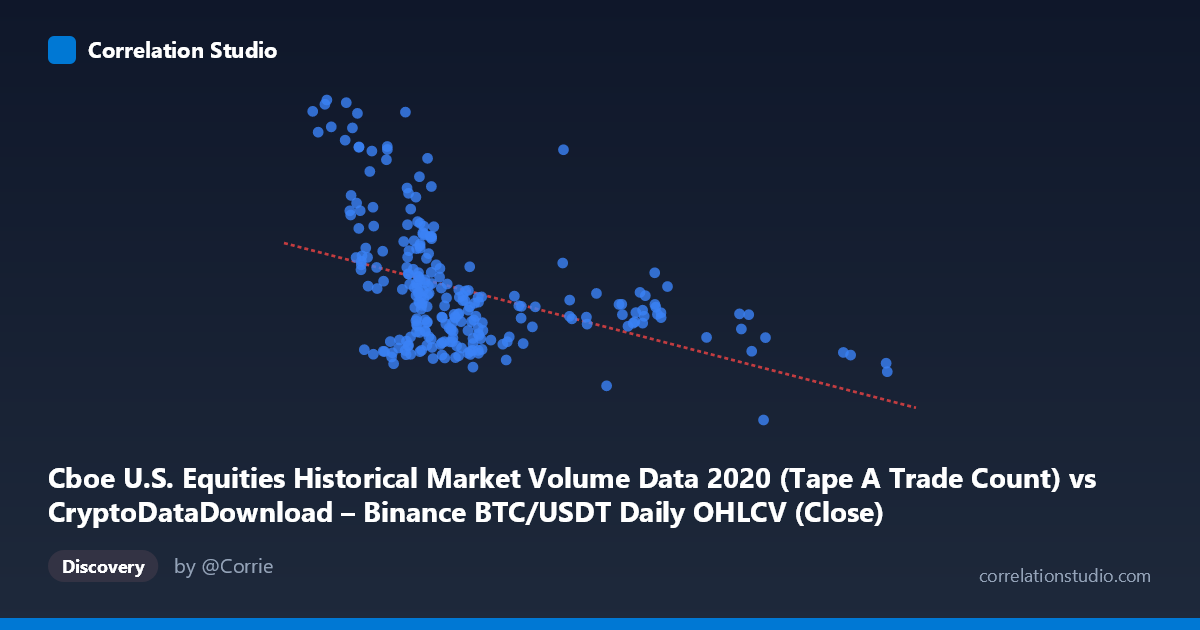
Cboe U.S. Equities Historical Market Volume Data 2020 (Tape A Trade Count) vs CryptoDataDownload – Binance BTC/USDT Daily OHLCV (Close)
- Pearson correlation (r)
- -0.4343
- Spearman correlation
- -0.4811
- p-value
- 0
- Sample size (n)
- 253
- 95% confidence interval
- -0.5293 to -0.3285
- Granger causality
- None
- Granger optimal lag
- 10
AI analysis
Analysis: Cboe Equities Trade Count vs. BTC/USDT Close Price (2020)
1. What the Visualization Reveals
The scatterplot shows a modest negative relationship between Cboe U.S. equities trade counts (X) and Bitcoin's closing price (Y) across 253 paired daily observations in 2020. The data cloud is diffuse rather than tightly banded around the regression line, indicating that while a downward trend exists, it is far from a tight linear relationship. Most X values cluster between 7,000–12,000, with a sparser tail extending to ~29,000, while Y ranges widely from ~667K to 3.27M, reflecting Bitcoin's dramatic price appreciation over the course of 2020.
2. Strength, Direction, and Statistical Confidence
The correlation coefficient (r = -0.4343) indicates a moderate negative linear relationship: as equity trade counts increase, Bitcoin's closing price tends to decrease. However, r² = 0.1886 means only about 18.9% of the variance in BTC price is statistically associated with trade count variation — the remaining ~81% is driven by other factors entirely. The 95% CI [-0.529, -0.329] is reasonably tight and excludes zero, and the p-value (4.6×10⁻¹³) confirms this correlation is highly unlikely to be due to chance given the sample. That said, statistical significance here reflects sample size and consistency, not practical strength — this is a weak-to-moderate association, not a reliable predictive relationship. Critically, the Granger causality tests show no significant predictive direction in either direction (X→Y: p=0.863; Y→X: p=0.400), meaning past values of one series do not meaningfully improve forecasts of the other. This strongly suggests the correlation is likely coincidental or driven by shared external trends rather than any causal or lead-lag mechanism.
3. Notable Patterns and Outliers
Several high-Y outliers stand out — points like (8692.91, 3,169,394) and (5578.60, 3,049,714) — where relatively low trade counts coincide with very high BTC prices, likely corresponding to late-2020's bull run (Nov–Dec) when Bitcoin surged past $20K-$28K while equity trading activity was comparatively subdued during that period. Conversely, points with mid-range X (10,000–12,000) and lower Y (~1.2M–1.5M) form a dense cluster, likely representing calmer mid-year months. The high-X tail (18,000–29,000) shows consistently modest, non-extreme Y values, suggesting that extreme equity trading days (possibly March 2020 COVID crash volatility) did not coincide with Bitcoin's price extremes — if anything, these high-volume equity days align with lower/mid BTC prices, reinforcing the negative trend but also hinting at a threshold or non-linear effect rather than a smooth linear one.
4. Confounding Factors and Caveats
This correlation is almost certainly confounded by shared time trends rather than direct interaction. Both series evolved throughout 2020 due to the COVID-19 market crash (Feb-Mar) and subsequent recovery, but through different mechanisms — equity trade counts spiked due to volatility-driven trading/retail participation, while BTC's rise was driven by institutional adoption, monetary stimulus, and crypto-specific narratives. Since both are time series with strong autocorrelation and trend components, simple correlation can produce spurious relationships (a classic "trending series" artifact) even absent Granger causality. The mismatched units (trade count vs. price level) and lack of detrending/differencing further weaken the interpretability of r as a measure of genuine co-movement.
5. Actionable Insights
Given the lack of Granger causality, this pair should not be used for predictive modeling or trading signal generation based on lead-lag assumptions. Analysts should instead: (a) detrend or difference both series (e.g., use daily returns/changes instead of levels) and recompute correlation to check if the relationship persists or vanishes — a strong sign of spurious trend-driven correlation; (b) consider adding a time/month variable or splitting the analysis into sub-periods (pre/post-COVID crash) to see if the relationship is driven by a specific volatile window; and (c) explore genuine confounders like VIX, monetary policy events, or retail trading app usage that might simultaneously affect both equity trade volume and crypto pricing, rather than treating this as a direct bivariate relationship.
X dataset: CryptoDataDownload – Binance BTC/USDT Daily OHLCV
Y dataset: Cboe U.S. Equities Historical Market Volume Data 2020
Part of experiment: Bitcoin - CryptoDataDownload – Binance BTC/USDT Daily OHLCV vs Cboe U.S. Equities Historical Market Volume Data 2020