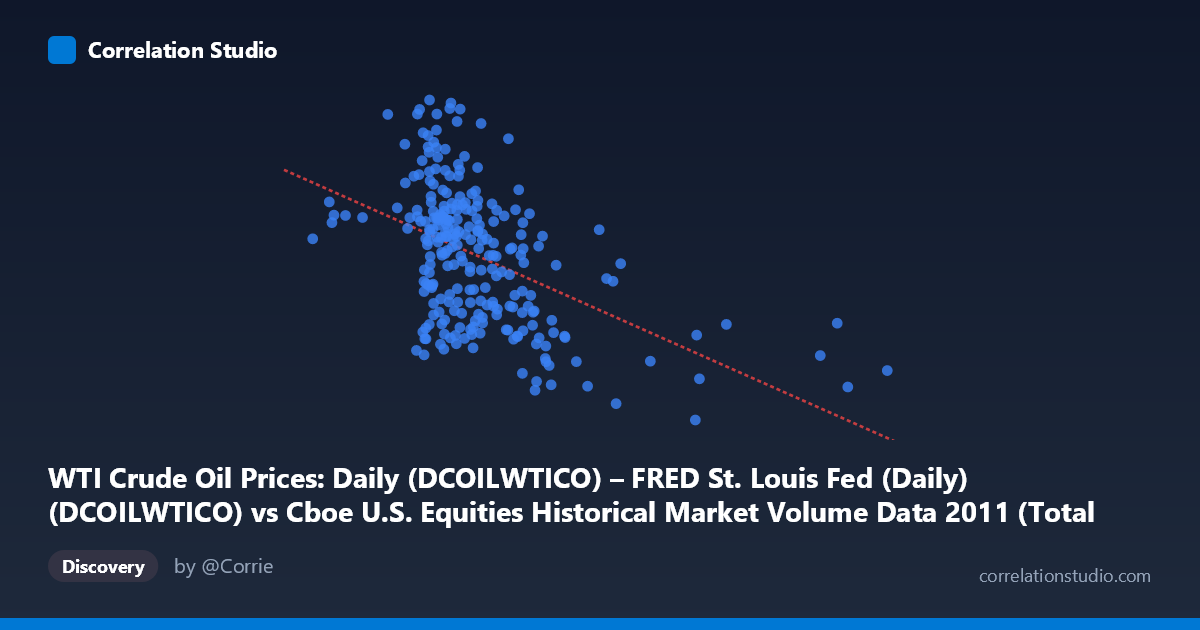
WTI Crude Oil Prices: Daily (DCOILWTICO) – FRED St. Louis Fed (Daily) (DCOILWTICO) vs Cboe U.S. Equities Historical Market Volume Data 2011 (Total Trade Count)
- Pearson correlation (r)
- -0.4855
- Spearman correlation
- -0.4683
- p-value
- 0
- Sample size (n)
- 252
- 95% confidence interval
- -0.5746 to -0.3851
- Granger causality
- Y → X
- Granger optimal lag
- 1
AI analysis
Analysis: WTI Crude Oil Prices vs. U.S. Equity Market Total Trade Count (2011)
Relationship Overview The scatterplot reveals a moderate negative relationship between WTI crude oil prices (X-axis) and the total trade count on U.S. equity exchanges (Y-axis) throughout 2011. As crude oil prices rise, equity market trade counts tend to decline, and vice versa. The linear regression equation (y = -7.32×10⁻⁶x + 109.697) captures this downward trend, though the scatter around the regression line is substantial, indicating that oil prices alone are far from a complete explanation of trading activity. The data points form a broadly dispersed cloud with a discernible negative tilt, concentrated most densely in the X range of roughly 1.5M–2.5M (representing trade counts), with oil prices clustering between approximately $85–$105 per barrel.
Correlation Strength, Direction, and Causality The Pearson correlation of r = -0.4855 indicates a moderate negative association, but the explanatory power is notably limited: r² = 0.2357 means only ~23.6% of the variance in trade counts is explained by oil price movements, leaving roughly three-quarters of the variation attributable to other factors. The 95% confidence interval of [-0.5746, -0.3851] is entirely negative and does not cross zero, and the p-value of 2.22×10⁻¹⁶ confirms this relationship is highly statistically significant — not a result of random chance. Critically, the Granger causality analysis points to a unidirectional temporal relationship: Y Granger-causes X (F = 3.98, p = 0.047), meaning that lagged trade count data contains statistically useful information for predicting subsequent oil prices, but the reverse is not supported (F = 0.005, p = 0.944). This is a notable and somewhat counterintuitive finding — equity market trading activity may serve as a weak leading indicator of oil price movements, potentially reflecting broader risk sentiment shifts that precede commodity repricing.
Notable Patterns, Clusters, and Outliers Several features stand out in the visualization. There is a visible cluster of high-Y, low-to-moderate-X points — days with elevated trade counts (above ~105) tend to occur when oil prices are in the lower range (~$75–$95/barrel), consistent with the negative correlation. Conversely, points with very high X values (oil prices above $3M notional equivalent, i.e., above ~$100/barrel) are predominantly associated with lower trade counts. A handful of apparent outliers are visible: at least one point with very high oil prices (~$110+/barrel, upper right region) and one with unusually low trade counts at moderate oil prices (~$78–$83), which may correspond to specific market events in 2011 such as the Arab Spring price spikes (spring 2011) or the August 2011 market volatility episode. The relationship also appears to exhibit mild non-linearity or heteroscedasticity — variance in trade counts appears somewhat wider at lower oil prices, suggesting the relationship may not be strictly linear across the full price range.
Confounding Factors and Caveats Several important caveats apply to this analysis. 2011 was an exceptional year — it included the Arab Spring, the Fukushima disaster, the U.S. debt ceiling crisis, and the European sovereign debt crisis, all of which independently drove both oil prices and equity market volatility and volume in complex ways. The observed negative correlation may partly reflect a risk-off/risk-on dynamic: when macroeconomic uncertainty rises, investors flee equities (reducing trade counts) while oil prices react to geopolitical supply fears — making broader risk sentiment a likely confounding third variable rather than a direct causal channel. Additionally, the Granger causality result, while statistically significant at p = 0.047, is only marginally so, and Granger causality does not imply true economic causality — it merely indicates temporal predictive precedence within this specific sample. The sample covers only one calendar year (N = 3,780 underlying observations, n = 252 paired daily samples), limiting generalizability.
Actionable Insights and Further Investigation Practitioners and researchers should treat this correlation as a useful but incomplete signal. The finding that trade count may weakly Granger-cause oil prices warrants further investigation — potentially through vector autoregression (VAR) modeling that incorporates additional variables such as the VIX (volatility index), equity index returns, USD strength, and geopolitical event dummies to disentangle the true drivers. It would be valuable to replicate this analysis across multiple years to test whether the negative correlation and causal direction are stable phenomena or artifacts of 2011's unique macro environment. For practitioners monitoring equity market microstructure, a decline in trade counts could be added as a weak early-warning signal in commodity market dashboards. Finally, given the heteroscedasticity suggested in the plot, a non-linear or quantile regression approach may better characterize the relationship across different oil price regimes.
X dataset: Cboe U.S. Equities Historical Market Volume Data 2011
Y dataset: WTI Crude Oil Prices: Daily (DCOILWTICO) – FRED St. Louis Fed (Daily)
Part of experiment: Daily - Cboe U.S. Equities Historical Market Volume Data 2011 vs WTI Crude Oil Prices: Daily (DCOILWTICO) – FRED St. Louis Fed (Daily)