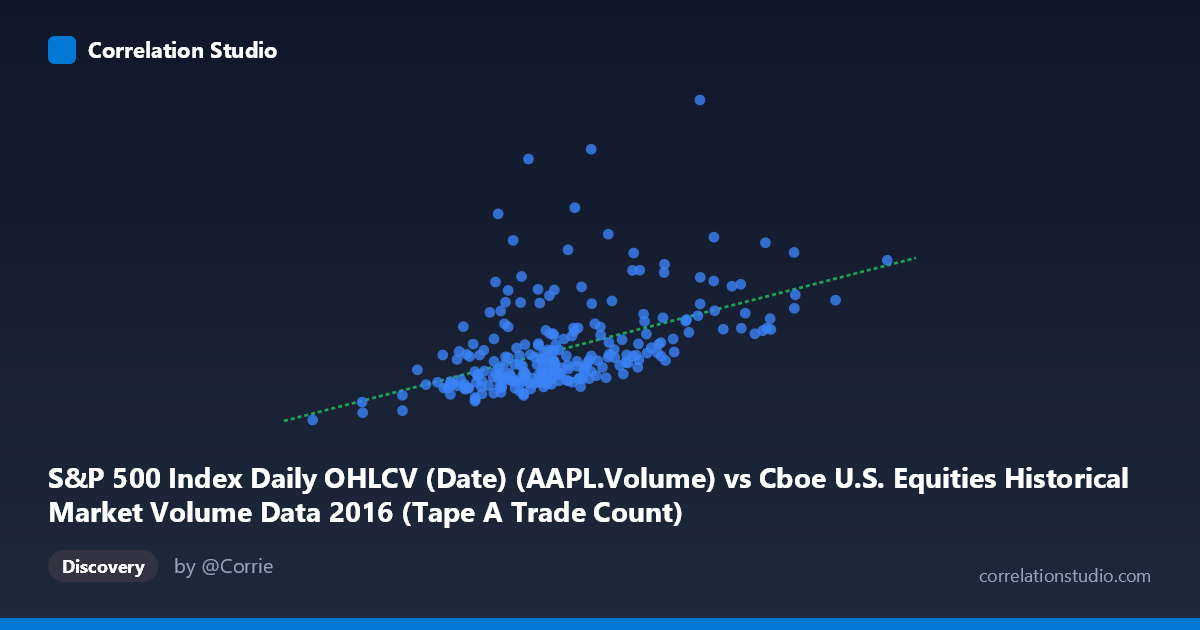
S&P 500 Index Daily OHLCV (Date) (AAPL.Volume) vs Cboe U.S. Equities Historical Market Volume Data 2016 (Tape A Trade Count)
- Pearson correlation (r)
- 0.5021
- Spearman correlation
- 0.5772
- p-value
- 0
- Sample size (n)
- 252
- 95% confidence interval
- 0.4035 to 0.5891
- Granger causality
- None
- Granger optimal lag
- 10
AI analysis
Scatterplot Analysis: AAPL Volume vs. Cboe Tape A Trade Count (2016)
Relationship Overview The scatterplot reveals a moderate positive relationship between Apple Inc.'s daily trading volume (S&P 500 OHLCV dataset) and the Cboe U.S. Equities Tape A Trade Count across 252 paired trading days in 2016. As AAPL volume increases, Tape A trade counts tend to rise correspondingly, which is intuitively sensible — both metrics are fundamentally driven by overall market activity levels. The linear regression equation (y = 28.86x − 1,673,490) suggests that for every additional share of AAPL traded, the Tape A trade count increases by approximately 29 units, though this coefficient reflects correlation rather than any causal mechanism.
Correlation Strength and Statistical Significance The Pearson correlation of r = 0.50 indicates a moderate positive association, but the explanatory power is notably limited: r² = 0.2521, meaning only 25.2% of the variance in Tape A trade counts is explained by AAPL volume. The remaining ~75% is attributable to other factors entirely. The 95% confidence interval of [0.40, 0.59] is relatively tight and does not include zero, and the p-value of essentially 0 confirms the correlation is statistically robust and unlikely to be a chance artifact given n = 252. However, statistical significance should not be confused with practical magnitude — a quarter of variance explained is a meaningful but far from dominant relationship. Critically, Granger causality tests found no significant predictive direction in either direction (X→Y: F = 1.18, p = 0.31; Y→X: F = 1.03, p = 0.42), meaning AAPL volume does not temporally predict Tape A counts (nor vice versa) at any lag up to 10 periods. This rules out using one series to forecast the other with confidence.
Notable Patterns, Clusters, and Outliers The data cloud shows a broad, heteroscedastic spread — variance in Tape A trade counts appears to widen as AAPL volume increases, suggesting the relationship becomes less predictable at higher volume levels. Several prominent outliers are visible in the upper region: notably one point near (1,433,202; 92,344,800), another near (1,409,909; 76,314,700), and a striking extreme at approximately (1,859,406; 133,369,700) — which represents the highest Tape A trade count in the dataset despite only moderate AAPL volume. This last point alone could be exerting disproportionate leverage on the regression line. The bulk of observations cluster between X values of 1.0M–1.6M and Y values of 20M–55M, forming a moderately coherent core, while the upper-Y outliers suggest episodic market events that dramatically elevated trade counts independently of AAPL activity.
Confounding Factors and Caveats Several important caveats apply. First, both variables are proxies for overall market activity, so the correlation may largely reflect a shared dependency on macro market conditions (e.g., volatility events, Fed announcements, earnings seasons) rather than any direct linkage between AAPL and Cboe Tape A specifically. Second, the dataset labels appear cross-swapped — AAPL Volume is listed from the Cboe dataset and Tape A Trade Count from the S&P 500 dataset, suggesting a possible data join or labeling inconsistency that warrants verification before drawing firm conclusions. Third, 2016 was a distinctive year (U.S. presidential election, Brexit aftermath, Fed rate decisions) with episodic volatility spikes that could artificially inflate correlation by creating simultaneous extremes in both series. Finally, the heteroscedasticity observed suggests a linear model may not be the best fit, and a log-log or polynomial specification could better characterize the relationship.
Actionable Insights and Further Investigation Given that only ~25% of variance is explained and Granger causality is absent, AAPL volume alone is a weak and non-predictive signal for Tape A trade counts in real-time or forecasting applications. Practitioners should avoid using one to predict the other in trading models. Further investigation should: (1) examine the upper outliers individually to identify the specific dates and market events driving those anomalous Tape A counts; (2) test alternative functional forms (log-linear, power law) given the apparent heteroscedasticity; (3) introduce composite volume metrics (total S&P 500 volume or VIX) as control variables to isolate whether the AAPL-Tape A relationship persists after accounting for broad market activity; and (4) verify dataset column assignments to ensure the cross-dataset join is correctly aligned before any production use of this correlation.
X dataset: Cboe U.S. Equities Historical Market Volume Data 2016
Y dataset: S&P 500 Index Daily OHLCV (Date)
Part of experiment: Daily - Cboe U.S. Equities Historical Market Volume Data 2016 vs S&P 500 Index Daily OHLCV (Date)