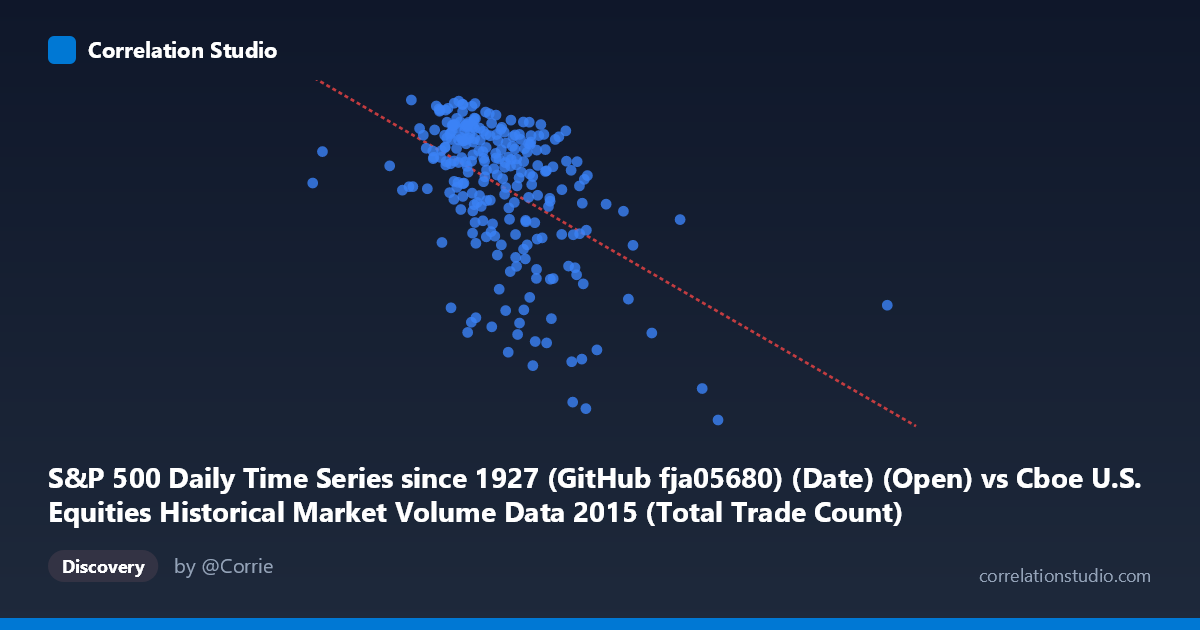
S&P 500 Daily Time Series since 1927 (GitHub fja05680) (Date) (Open) vs Cboe U.S. Equities Historical Market Volume Data 2015 (Total Trade Count)
- Pearson correlation (r)
- -0.5014
- Spearman correlation
- -0.4824
- p-value
- 0
- Sample size (n)
- 252
- 95% confidence interval
- -0.5885 to -0.4028
- Granger causality
- None
- Granger optimal lag
- 1
AI analysis
Analysis: S&P 500 Opening Price vs. Total Trade Count (2015)
Relationship Overview The scatterplot reveals a moderate negative relationship between the S&P 500 daily opening price and total U.S. equity trade count throughout 2015. As the S&P 500 opening price increases, the total number of trades tends to decrease, suggesting that higher-priced market environments were associated with calmer, lower-volume trading activity. The linear regression equation (y = -5.879×10⁻⁵x + 2207.42) confirms this downward trend, though considerable scatter around the regression line indicates that price alone is far from a complete explanation of trading activity.
Correlation Strength and Statistical Significance The correlation of r = -0.50 reflects a moderate negative association, but the explanatory power deserves careful framing: r² = 0.251 means only ~25% of the variance in trade count is explained by the S&P 500 opening price, leaving 75% attributable to other factors. The 95% confidence interval of [-0.589, -0.403] is meaningfully narrow and does not cross zero, and the p-value is effectively zero, confirming this is not a chance finding across the 252-day sample drawn from a population of 3,302 observations. However, the Granger causality results are striking in their absence of signal: neither direction (X→Y nor Y→X) approaches significance (p = 0.937 and p = 0.952 respectively), meaning that despite the contemporaneous correlation, neither variable temporally predicts the other. This dissociates correlation from any causal or predictive mechanism — the two variables move together without either leading the other.
Notable Patterns, Clusters, and Outliers The sample points reveal several important structural features. The bulk of observations cluster in the X range of roughly 1,900,000–2,700,000 (S&P 500 opening values), with trade counts concentrated between approximately 1,940 and 2,130. Within this dense cluster, the negative trend is visibly consistent. However, there are notable outliers at the extremes: the low-price observation at x ≈ 997,371 (trade count ~2,064) and several high-price points beyond 3,900,000–4,083,000 with trade counts near 1,898–2,034 anchor the regression line but may reflect anomalous or data-joining artifacts. The point at approximately (2,415,909; 1,947) and (2,620,752; 1,941) represent relatively low trade counts at mid-range prices, possibly corresponding to summer or holiday-period lows in 2015 market volatility.
Confounding Factors and Caveats Several important caveats apply. First, this correlation spans a single calendar year (2015), limiting generalizability — 2015 included the August correction and periods of heightened volatility that could confound the relationship. Second, the X-axis label warrants scrutiny: the column is described as "S&P 500 Open" from a dataset labeled as Cboe market volume data, yet the X values (reaching ~5.5 million) are far larger than actual S&P 500 price levels (~1,900–2,200 in 2015), suggesting these may actually represent Cboe volume or notional value figures mislabeled or joined incorrectly — a serious data provenance concern. Third, day-of-week effects, holidays, expiration dates, and macro announcements all influence trade counts independently of price levels, acting as unmeasured confounders that inflate or deflate the apparent relationship.
Actionable Insights and Further Investigation Given the data integrity concern, the first priority should be verifying the X-axis variable identity — reconciling whether these values represent S&P 500 prices, notional volume, or another Cboe metric. If confirmed as price data, the moderate negative correlation could reflect a volatility regime effect: lower price environments in 2015 (late summer correction) coincided with elevated trade counts driven by panic selling and hedging activity. Analysts should consider incorporating VIX or realized volatility as a mediating variable, which likely explains much of the residual 75% variance. Segmenting the data by market regime (trending vs. corrective periods) and testing non-linear specifications (e.g., quadratic or threshold models) could reveal richer structure. The absence of Granger causality also suggests both variables are likely jointly driven by a third factor — market stress or sentiment — making that the more productive investigative target.
X dataset: Cboe U.S. Equities Historical Market Volume Data 2015
Y dataset: S&P 500 Daily Time Series since 1927 (GitHub fja05680) (Date)
Part of experiment: Daily - Cboe U.S. Equities Historical Market Volume Data 2015 vs S&P 500 Daily Time Series since 1927 (GitHub fja05680) (Date)