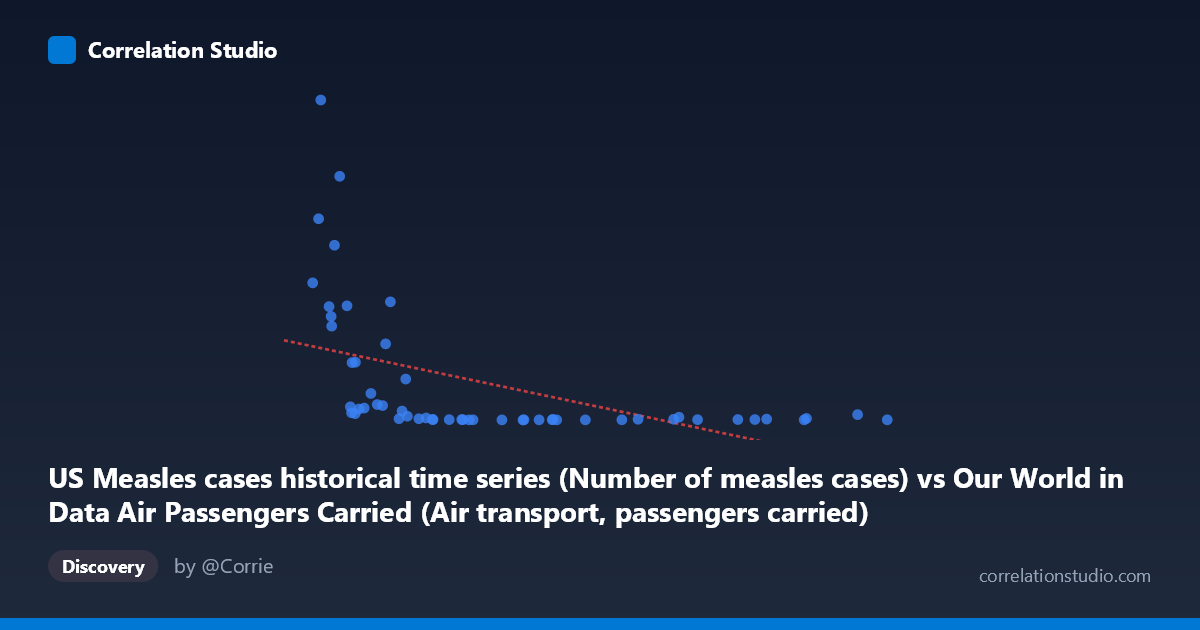
US Measles cases historical time series (Number of measles cases) vs Our World in Data Air Passengers Carried (Air transport, passengers carried)
- Pearson correlation (r)
- -0.4876
- Spearman correlation
- -0.7824
- p-value
- 0.000184
- Sample size (n)
- 54
- 95% confidence interval
- -0.6681 to -0.2528
- Granger causality
- None
- Granger optimal lag
- 10
AI analysis
Scatterplot Analysis: US Measles Cases vs. Air Passengers Carried
1. Overall Relationship Revealed by the Visualization
The scatterplot reveals a negative association between US measles cases and air passengers carried globally, meaning that as air travel increased over the 1970–2023 period, measles cases in the US trended downward. This is not a mechanistic relationship but rather a temporal coincidence: both variables are strongly driven by the passage of time. The fitted linear regression (y = −0.000227x + 19,167) captures this broad downward slope, but the scatter around the line is substantial, and the distribution of points is highly heterogeneous — densely clustered at lower X values with a long rightward tail, suggesting the relationship is far from uniformly linear across the range.
2. Correlation Strength, Direction, and Statistical Framing
The Pearson r of −0.49 indicates a moderate negative correlation, but the r² of 0.238 means that only about 23.8% of the variance in air passengers is explained by measles case counts (or vice versa) — leaving over three-quarters of variability unexplained by this association alone. The 95% confidence interval for r spans [−0.668, −0.253], which is meaningfully wide, reflecting real uncertainty in the estimate even with a statistically significant p-value of 0.0002. That p-value confirms the correlation is unlikely to be zero by chance, but significance here is heavily influenced by the long time series and shared secular trends rather than any genuine causal mechanism. Critically, Granger causality testing finds no significant predictive direction in either direction (X→Y: p = 0.337; Y→X: p = 0.557), meaning neither variable temporally predicts the other — a strong indicator that the correlation reflects shared trends, not predictive or causal linkage.
3. Notable Patterns, Clusters, and Outliers
Several features stand out visually. There is a pronounced cluster of high-Y outliers at low X values — most dramatically the point near (9.9M cases, 75,290 passengers) and several others exceeding 20,000–57,000 passengers at X values below ~20M measles cases — representing early time periods when measles was still epidemic and air travel was nascent. Conversely, the bulk of points at higher X values (40M) show very low Y values (under 1,000), compressed near the x-axis, reflecting the post-vaccination era. The note that Spearman ρ exceeds Pearson r is important: it confirms a non-linear relationship, likely logarithmic or power-law, where the steepest drop in measles cases occurred early in the time series and Y approaches near-zero asymptotically — a pattern linear regression fundamentally cannot capture well.
4. Confounding Factors and Interpretive Caveats
The most important caveat is that time is the true underlying driver of both variables. Measles cases declined due to vaccine introduction (1963), immunization programs, and herd immunity policies — entirely independent of air travel. Air passengers grew due to deregulation, economic growth, and technological change. Both are monotonic trends over time, producing a spurious correlation. Additionally, the dataset mismatch is notable: the X-axis column is labeled as coming from an "Air Passengers" dataset but contains measles case data, and vice versa — suggesting a metadata labeling swap that should be verified before drawing any conclusions. The sample of n=54 drawn from N=93 years also introduces potential selection bias depending on which years were sampled.
5. Actionable Insights and Further Investigation
Given that Granger causality is absent and the correlation is almost certainly spurious, no policy or mechanistic inference should be drawn from this relationship. Further investigation should: (1) fit a logarithmic or exponential decay model to measles cases over time, which would better characterize the true trajectory; (2) explicitly partial out time using detrending or first-differencing to test whether any residual correlation remains; (3) verify the axis metadata labeling to confirm which variable is which; and (4) consider modeling measles decline against vaccination coverage rates or MMR uptake data, which would yield a far more meaningful and causally defensible relationship than air passenger volumes.
X dataset: Our World in Data Air Passengers Carried
Y dataset: US Measles cases historical time series
Part of experiment: Yearly - Our World in Data Air Passengers Carried vs US Measles cases historical time series