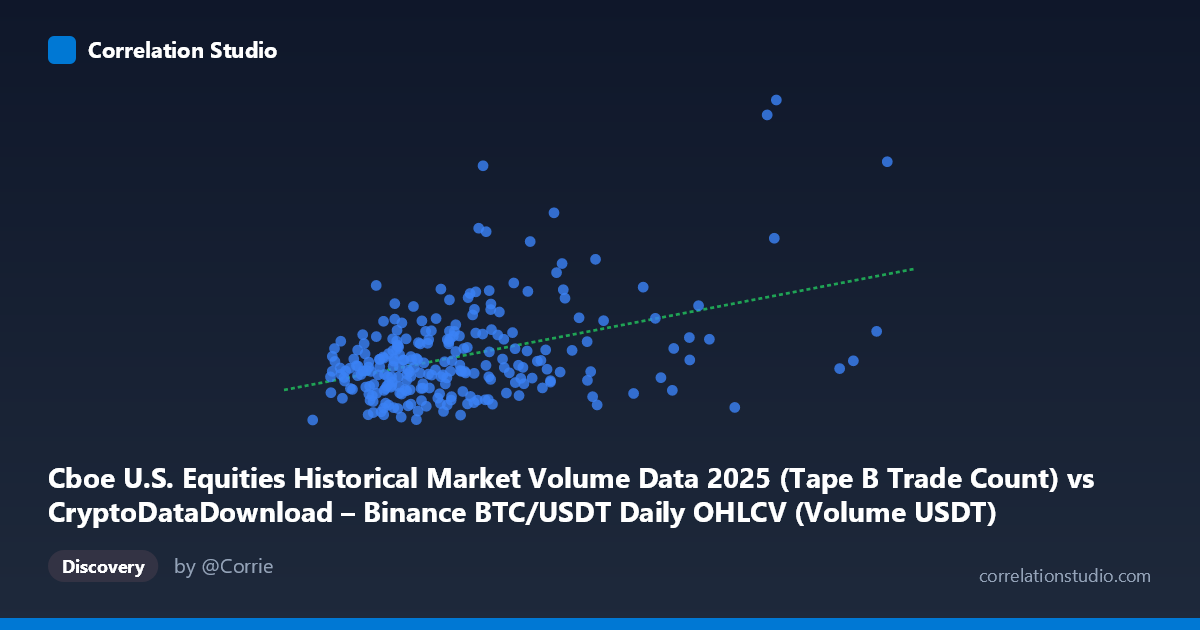
Cboe U.S. Equities Historical Market Volume Data 2025 (Tape B Trade Count) vs CryptoDataDownload – Binance BTC/USDT Daily OHLCV (Volume USDT)
- Pearson correlation (r)
- 0.4185
- Spearman correlation
- 0.2886
- p-value
- 0
- Sample size (n)
- 250
- 95% confidence interval
- 0.3106 to 0.5158
- Granger causality
- None
- Granger optimal lag
- 10
AI analysis
Analysis: Cboe Equities Trade Count vs. Binance BTC/USDT Volume (USDT)
1. Overview of the Relationship
The scatterplot displays a modest positive relationship between two variables drawn from unrelated market domains — U.S. equities trade counts (Tape B) and BTC/USDT trading volume on Binance. The data forms a diffuse, cone-shaped cloud rather than a tight linear band, with visible heteroscedasticity: as the X variable (equities trade count) increases, the spread in Y (crypto volume) appears to widen somewhat, though the density of points remains concentrated in the lower-left/mid region (X roughly 1.3B–2.5B).
2. Strength, Direction, and Statistical Confidence
The correlation coefficient (r = 0.4185) indicates a weak-to-moderate positive relationship. The r² value of 0.175 means only about 17.5% of the variance in BTC/USDT volume is statistically associated with variance in Cboe trade counts — leaving over 82% unexplained by this single variable. The 95% CI [0.311, 0.516] is reasonably tight and does not cross zero, and the p-value (5.07E-12) is highly significant, confirming this correlation is very unlikely due to sampling noise given n=250. However, statistical significance here reflects sample size and consistency, not practical strength — the relationship is real but weak. Critically, the Granger causality tests show no significant predictive direction in either direction (X→Y: p=0.597; Y→X: p=0.456) at the optimal lag of 10 periods. This means neither series meaningfully helps forecast the other's future values — the correlation appears to be a contemporaneous or coincidental association, not a lead-lag dynamic.
3. Patterns, Clusters, and Outliers
Several notable features stand out: - Right-tail outliers: A handful of high-X points (e.g., ~4.0B–5.3B) exist somewhat isolated from the main cluster, some with high Y values (~1.05M) and some with low Y (~470K–740K) — these don't clearly extend the trend, suggesting non-linearity or noise at the extremes. - Vertical scatter at low-mid X: Even within the dense X range (1.3B–2.0B), Y varies enormously (400K to 900K+), indicating X alone is a poor predictor for most of the data. - No obvious clusters or regime breaks are apparent — the cloud is continuous, without evidence of bimodality or distinct sub-populations.
4. Confounding Factors and Caveats
This pairing is conceptually unusual: it compares a U.S. equities market activity metric to a crypto exchange volume metric, two markets with different trading hours, participants, and regulatory structures. Any correlation is more likely driven by shared macro factors — such as overall market-wide volatility, risk sentiment, seasonal trading patterns, or simply both series trending over the same 2025 calendar year — rather than a direct causal or mechanistic link. Additionally, n=250 is a sample from a population of 3,212, and the sampling method (every 5th point shown) could introduce autocorrelation if data are time-ordered, potentially inflating apparent correlation while masking true independence (consistent with the null Granger result).
5. Suggestions for Further Investigation
- Test for spurious correlation via detrending: Apply differencing or examine correlation of daily changes (returns) rather than levels, since both series likely trend upward over time, which alone can create correlation. - Introduce a common driver variable: Check whether both series correlate independently with broader market volatility indices (VIX) or macro liquidity measures. - Segment by time period: Break 2025 into quarters to see if the relationship is stable or driven by specific events (e.g., a shared volatility spike). - Avoid using this pair for forecasting: Given the null Granger causality result, this relationship should not be used for predictive trading strategies linking equities activity to crypto volume.
X dataset: CryptoDataDownload – Binance BTC/USDT Daily OHLCV
Y dataset: Cboe U.S. Equities Historical Market Volume Data 2025
Part of experiment: Bitcoin - CryptoDataDownload – Binance BTC/USDT Daily OHLCV vs Cboe U.S. Equities Historical Market Volume Data 2025