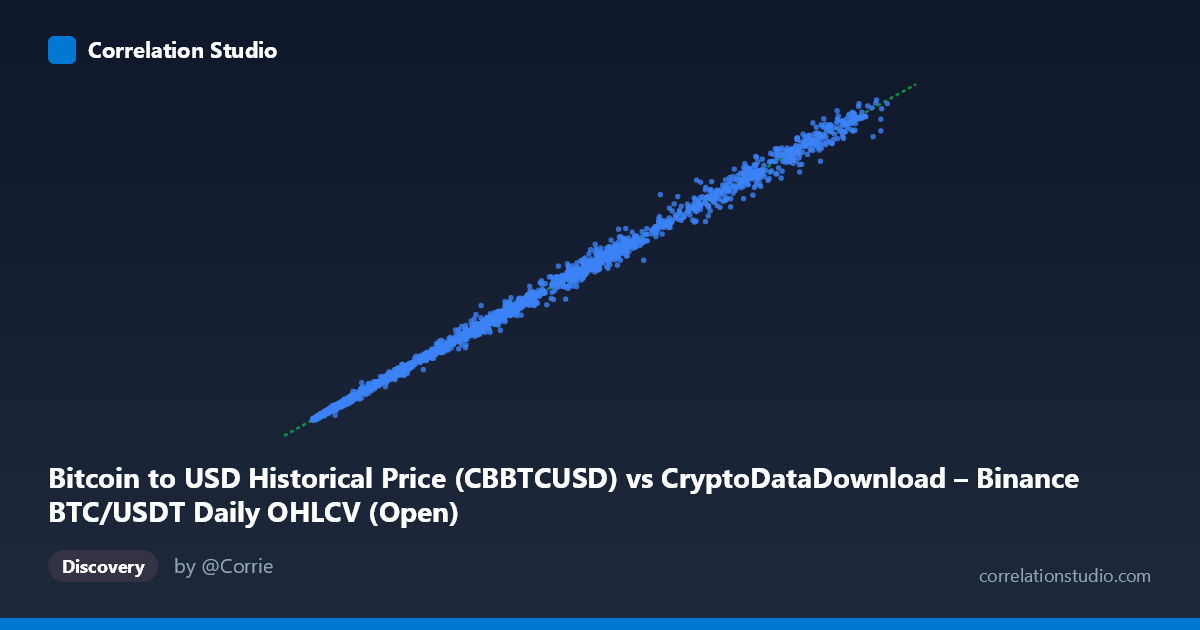
Bitcoin to USD Historical Price (CBBTCUSD) vs CryptoDataDownload – Binance BTC/USDT Daily OHLCV (Open)
- Pearson correlation (r)
- 0.9989
- Spearman correlation
- 0.999
- p-value
- 0
- Sample size (n)
- 3211
- 95% confidence interval
- 0.9988 to 0.999
- Granger causality
- None
- Granger optimal lag
- 10
- Time coverage
- 2017-08-17 to 2026-06-25
- Recomputed on refreshed data
- 2026-10-23 (r was 0.9989)
AI analysis
Analysis: BTC/USDT (Binance) vs. Bitcoin/USD (Coinbase) Price Series
1. What the Visualization Reveals
The scatterplot shows an almost perfectly linear relationship between Bitcoin's price on Binance (BTC/USDT) and Bitcoin's price on Coinbase (BTC/USD) across nearly 3,200 daily observations spanning 2017–2026. Points hug a tight diagonal band with slope ≈ 1.0 (0.9995) and a near-zero intercept (~$64.63), meaning the two series track each other essentially one-to-one across the entire price range — from ~$3,200 to ~$124,700. This is the expected signature of two exchanges pricing the same underlying asset, not two genuinely distinct variables.
2. Strength, Direction, and Uncertainty
The correlation is exceptionally strong (r = 0.9989, r² = 0.9978), meaning 99.78% of the variance in one exchange's price is explained by the other's. The 95% CI [0.9988, 0.9990] is extremely tight given the large sample (n=3,211), and the p-value is effectively zero — leaving no meaningful doubt that this relationship is real and stable, not a sampling artifact. However, "correlation" here is almost a misnomer in the causal sense: the Granger causality test found no significant predictive direction in either direction (X→Y: p=0.264; Y→X: p=0.253). This confirms that neither exchange price "leads" the other in a forecasting sense at the tested lag (10 periods) — they move together contemporaneously because arbitrage keeps them synchronized in near real-time, not because one market mechanically drives the other with a detectable lag.
3. Notable Patterns and Outliers
The relationship is remarkably linear across three orders of magnitude of price (low thousands to six figures), with no visible curvature, heteroscedasticity fanning, or regime breaks in the sample. A few sample rows show modest deviations — e.g., (57347.94, 61682.48), (49699.60, 51833.46), (97030.50, 102986.96) — where Y exceeds X by several percentage points, likely reflecting short-lived cross-exchange premiums/discounts (e.g., regional demand spikes, liquidity crunches, or timestamp misalignment between daily snapshots). These are minor relative to the overall scale and don't disrupt the dominant 1:1 trend line.
4. Confounding Factors and Caveats
This is a case where high correlation reflects definitional overlap, not an interesting empirical discovery — both series measure Bitcoin's price, just sourced from different venues (Binance vs. Coinbase) and possibly different timestamp/aggregation conventions (Open vs. Close, daily bar alignment). Key caveats: - Non-independence: Arbitrage bots keep exchange prices synchronized within seconds to minutes, so daily OHLCV data will almost always show near-unity correlation regardless of "cause." - Same underlying driver: Both series are jointly driven by global BTC market sentiment, macro conditions, and liquidity — there's no meaningful sense in which one "causes" the other beyond microstructure-level order flow. - Data granularity mismatch: Using Open-vs-Close or differing exchange time-zone cutoffs could introduce the small residual scatter seen in the sample.
5. Suggestions for Further Investigation
Given that price-level correlation here is close to tautological, more insight would come from analyzing the residuals/spread between the two series (Y − X or the ratio Y/X) as its own time series — this could reveal arbitrage opportunities, exchange-specific liquidity stress, or lead-lag effects at finer (intraday/hourly) granularity where Granger causality might actually show one exchange reacting faster to news. Additionally, examining volume-weighted or intraday microstructure data (rather than daily opens) could better capture genuine price discovery dynamics between Binance and Coinbase.
X dataset: CryptoDataDownload – Binance BTC/USDT Daily OHLCV
Y dataset: Bitcoin to USD Historical Price
Part of experiment: Bitcoin - CryptoDataDownload – Binance BTC/USDT Daily OHLCV vs Bitcoin to USD Historical Price