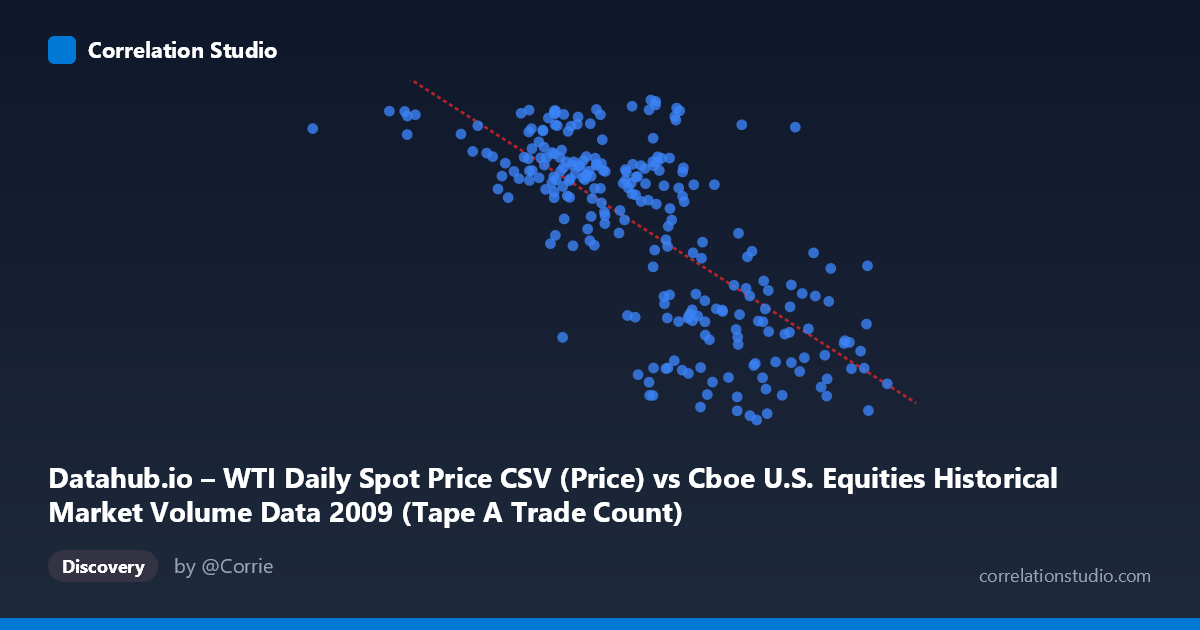
Datahub.io – WTI Daily Spot Price CSV (Price) vs Cboe U.S. Equities Historical Market Volume Data 2009 (Tape A Trade Count)
- Pearson correlation (r)
- -0.7184
- Spearman correlation
- -0.7048
- p-value
- 0
- Sample size (n)
- 252
- 95% confidence interval
- -0.7733 to -0.6528
- Granger causality
- None
- Granger optimal lag
- 1
AI analysis
Analysis: WTI Crude Oil Price vs. Tape A Trade Count (2009)
Relationship Overview The scatterplot reveals a moderately strong negative relationship between WTI daily spot prices (X-axis) and Tape A trade counts on U.S. equity exchanges (Y-axis) across 2009. As oil prices rise, the number of equity trades on Tape A tends to decline, and conversely, lower oil prices coincide with higher trading activity. The linear regression equation (y = -2.47×10⁻⁵x + 102.22) quantifies this inverse slope, suggesting that for every unit increase in the market volume metric on the X-axis, the WTI price drops by a small but consistent increment. The overall cloud of points slopes visibly downward from left to right, confirming the negative trend is not merely a statistical artifact.
Correlation Strength and Statistical Significance The Pearson correlation of r = -0.7184 indicates a moderately strong negative association. More meaningfully, R² = 0.5161 tells us that approximately 51.6% of the variance in Tape A trade counts is statistically explained by WTI prices — a substantial share, though nearly half the variance remains unexplained by this relationship alone. The 95% confidence interval of [-0.7733, -0.6528] is relatively narrow and lies entirely in negative territory, lending strong confidence that the true population correlation is indeed negative and non-trivial. The p-value of essentially zero confirms the result is highly statistically significant given n = 252 paired observations drawn from a population of N = 3,232. However, the Granger causality results undercut any causal narrative: neither direction (X→Y: F = 0.59, p = 0.44; Y→X: F = 1.33, p = 0.25) achieves significance at even a 0.10 threshold. This means neither variable reliably predicts the other in a temporally lagged sense — the correlation is contemporaneous and likely driven by shared external forces rather than a direct predictive mechanism.
Notable Patterns, Clusters, and Outliers Several structural features stand out in the data. There appears to be a distinct cluster of high trade-count observations (Y ≈ 70–81) concentrated at lower X values (roughly 362,000–1,600,000), which may correspond to the early 2009 period when oil prices were depressed following the 2008 financial crisis and equity market volatility was elevated. A second dense cluster at lower trade counts (Y ≈ 37–58) aligns with higher X values (2,000,000–2,550,000), potentially reflecting the latter half of 2009 as oil recovered. The point at (362,081, 76.83) appears as a potential outlier on the far left — an unusually low X value paired with a high trade count — and warrants investigation as a data anomaly or an extreme market day. Some scatter at mid-range values (X ≈ 1,600,000–1,900,000, Y ≈ 40–72) suggests the relationship is noisier in the intermediate range, hinting at possible non-linearity or regime changes during that period.
Confounding Factors and Caveats Several important caveats temper interpretation. 2009 was a historically anomalous year: it spanned the tail of the global financial crisis, the March equity market trough, and a dramatic oil price recovery from ~$30 to ~$80/barrel — making any correlation found in this period potentially specific to crisis dynamics rather than a structural relationship. The axes appear to be swapped in the dataset descriptions (the X-axis label references "WTI Daily Spot Price" but comes from the Cboe dataset, and vice versa), which introduces ambiguity about which variable is truly being measured on each axis and warrants data provenance verification. Furthermore, Tape A trade counts are influenced by algorithmic trading volumes, regulatory changes (e.g., SEC actions in 2009), and market-wide volatility (VIX), all of which correlate with both oil prices and equity activity independently. The absence of Granger causality also warns against assuming oil prices "cause" changes in trading behavior or vice versa.
Actionable Insights and Further Investigation Given that ~48% of variance remains unexplained and causality is absent, several investigative steps are warranted. First, introducing VIX or market volatility as a covariate would help determine whether fear/uncertainty is the true common driver of both elevated trade counts and depressed oil prices in 2009. Second, segmenting the data by quarter could test whether the correlation is stable across the year or driven primarily by the crisis-recovery transition in Q1–Q2. Third, verifying the axis labeling discrepancy in the dataset metadata is essential before drawing any policy or trading conclusions. Finally, exploring non-linear models (e.g., piecewise regression or LOESS smoothing) may better capture the apparent clustering behavior and regime shifts visible in the scatter, potentially improving explanatory power beyond the current 51.6% R².
X dataset: Cboe U.S. Equities Historical Market Volume Data 2009
Y dataset: Datahub.io – WTI Daily Spot Price CSV
Part of experiment: Daily - Cboe U.S. Equities Historical Market Volume Data 2009 vs Datahub.io – WTI Daily Spot Price CSV