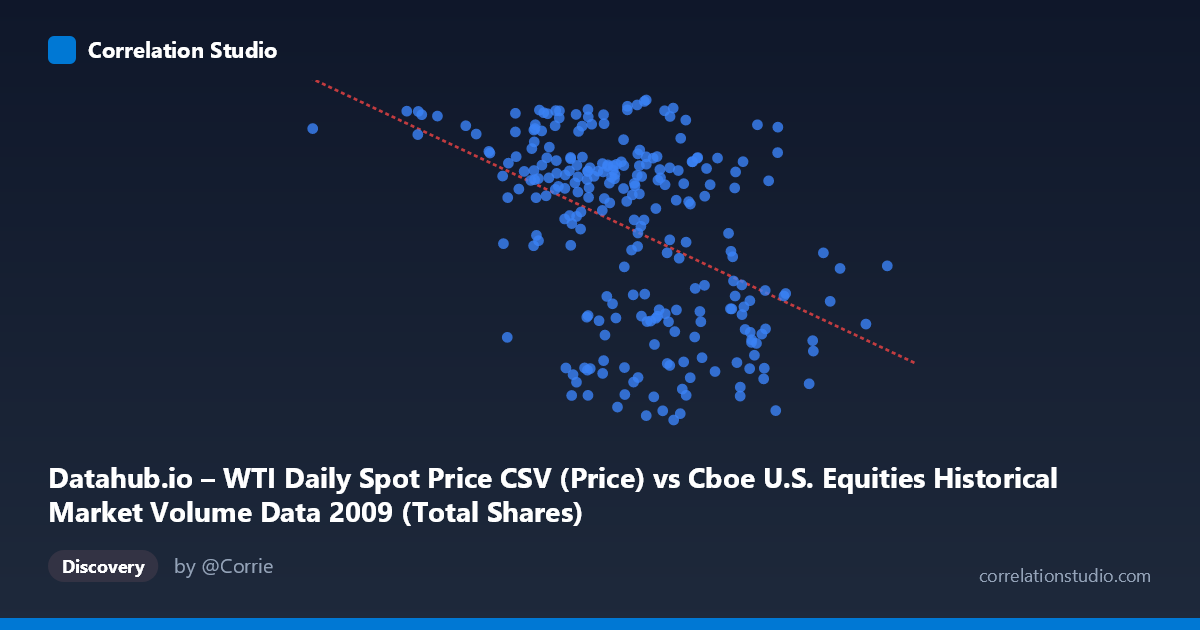
Datahub.io – WTI Daily Spot Price CSV (Price) vs Cboe U.S. Equities Historical Market Volume Data 2009 (Total Shares)
- Pearson correlation (r)
- -0.4531
- Spearman correlation
- -0.4389
- p-value
- 0
- Sample size (n)
- 252
- 95% confidence interval
- -0.5461 to -0.3491
- Granger causality
- None
- Granger optimal lag
- 1
AI analysis
Scatterplot Analysis: WTI Oil Price vs. U.S. Equity Market Volume (2009)
Relationship Overview
The scatterplot reveals a negative relationship between WTI crude oil spot prices (X-axis, measured in dollars per barrel) and total shares traded on U.S. equity exchanges (Y-axis). As oil prices increase, total equity market share volume tends to decline. This inverse pattern is visually apparent across the cloud of data points, with higher share volumes clustering at lower oil price levels and lower volumes predominating at higher price levels. The linear regression equation (y = -3.90025E-08x + 91.60) quantifies this: for every unit increase in the raw price index value, share volume decreases by approximately 3.9×10⁻⁸ units, though the practical magnitude is better understood through the normalized statistics.
Correlation Strength, Direction, and Statistical Significance
The Pearson correlation of r = -0.453 indicates a moderate negative association. However, the coefficient of determination tells a more sobering story: R² = 0.205, meaning oil prices explain only about 20.5% of the variance in equity share volume — leaving nearly 80% of the variability unexplained by this relationship alone. The 95% confidence interval for r ranges from -0.546 to -0.349, which is meaningfully wide but entirely on the negative side, confirming the direction of the relationship is reliable. The p-value of 3.664×10⁻¹⁴ is highly significant given n = 252 paired observations, making it virtually certain this correlation is not a product of chance sampling. Critically, however, the Granger causality tests failed to establish any significant temporal predictive direction in either direction (X→Y: F = 0.61, p = 0.43; Y→X: F = 0.12, p = 0.73). This means that even though a concurrent correlation exists, past oil prices do not help forecast future equity volumes, and vice versa — a crucial distinction that rules out simple predictive trading strategies based on this relationship.
Patterns, Clusters, and Outliers
The data cloud shows considerable vertical scatter at every X value, reinforcing the modest R². Several notable structural features are visible in the sample points. There appear to be two loose behavioral clusters: one grouping with lower oil prices (roughly below 700M on the X scale) where equity volumes span a wide range but skew toward higher values (65–80 range), and another at higher oil prices where volumes are more frequently depressed (35–55 range). Notable potential outliers include the point at (192,269,942.50, 76.83) — the minimum oil price observation paired with a relatively high share volume — and conversely, several high-price points (e.g., 1,073,811,434.54 at 39.35 and 1,099,082,415.08 at 58.58) sitting at the lower volume extreme. There is also some suggestion of non-linearity: volume appears to plateau or even rebound at intermediate price levels, rather than declining strictly monotonically, hinting that a simple linear model may not fully capture the relationship's shape.
Confounding Factors and Interpretive Caveats
The 2009 timeframe is heavily context-dependent, spanning the tail of the Global Financial Crisis recovery. Both oil prices and equity volumes in this period were simultaneously driven by powerful macroeconomic forces — Federal Reserve interventions, stimulus packages, and shifting risk sentiment — making it difficult to isolate any direct causal mechanism between the two variables. Equity market volume was also abnormally elevated in early 2009 due to panic selling and deleveraging, while oil prices were recovering from their 2008 collapse; these parallel but independently driven trends could easily generate a spurious or amplified negative correlation. Additionally, the axis labels suggest a dataset labeling transposition (WTI price is described as the Y-axis source while appearing on X), which warrants verification. With only 20.5% of variance explained and no Granger causality detected, omitted variables — such as VIX volatility, equity index levels, dollar strength, or sector rotation dynamics — almost certainly account for the majority of share volume fluctuations.
Actionable Insights and Further Investigation
Given the statistically significant but mechanistically ambiguous correlation, several next steps would sharpen the analysis. First, controlling for market volatility (VIX) and broad index levels (S&P 500) in a multivariate regression would help disentangle whether oil prices carry independent explanatory power or are simply a proxy for macroeconomic stress. Second, segmenting the data by month within 2009 would test whether the correlation is stable across different phases of the recovery or concentrated in specific crisis windows. Third, testing non-linear models (e.g., polynomial or piecewise regression) could better capture the apparent inflection visible in the scatter. Finally, extending the analysis to multiple years would determine whether this 2009 relationship is a structural feature of markets or an artifact of the extraordinary conditions of the post-crisis period — a critical test before drawing any policy or investment conclusions.
X dataset: Cboe U.S. Equities Historical Market Volume Data 2009
Y dataset: Datahub.io – WTI Daily Spot Price CSV
Part of experiment: Daily - Cboe U.S. Equities Historical Market Volume Data 2009 vs Datahub.io – WTI Daily Spot Price CSV