VIX Volatility Index Daily (FRED) (VIXCLS) vs Cboe U.S. Equities Historical Market Volume Data 2016 (Tape A Notional)
- Pearson correlation (r)
- 0.479
- Spearman correlation
- 0.4651
- p-value
- 0
- Sample size (n)
- 252
- 95% confidence interval
- 0.3778 to 0.5689
- Granger causality
- None
- Granger optimal lag
- 1
AI analysis
Analysis: VIX Volatility Index vs. Cboe U.S. Equities Tape A Notional Volume (2016)
Relationship Overview
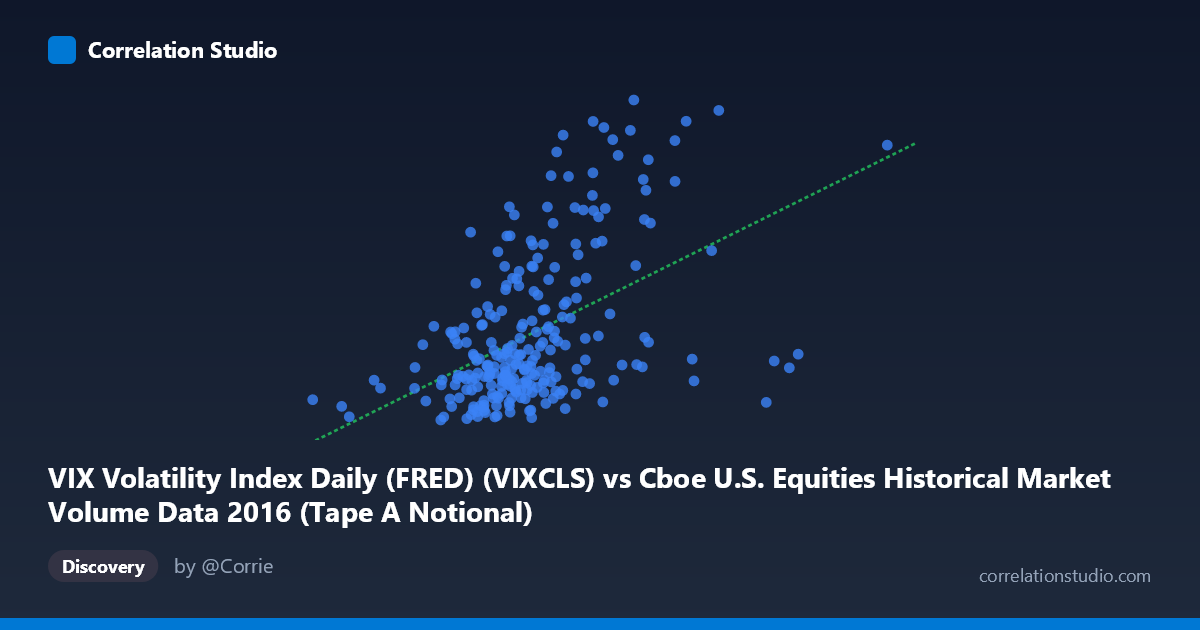
The scatterplot reveals a positive relationship between the VIX Volatility Index and Tape A notional trading volume in U.S. equities markets during 2016. As the VIX rises — reflecting greater implied volatility and market fear — notional trading volume tends to increase, consistent with the well-established financial intuition that volatile markets drive heightened trading activity. The linear regression equation (y = 1.073×10⁻⁹x + 6.18) captures this upward trend, though the scatter around the regression line is substantial, indicating the relationship is real but imprecise.
Correlation Strength and Statistical Significance
The correlation of r = 0.479 is moderate and statistically robust, with a p-value of 6.66×10⁻¹⁶ effectively ruling out chance as an explanation. However, the r² of 0.229 is the more sobering figure: VIX explains only ~23% of the variance in Tape A notional volume, meaning roughly 77% of volume variation stems from other sources entirely. The 95% confidence interval for r ([0.378, 0.569]) is reassuringly tight, reflecting the reasonable sample size (n=252 paired trading days), and confirms the correlation is meaningfully above zero. Critically, Granger causality tests found no significant predictive direction in either direction (X→Y: F=0.21, p=0.645; Y→X: F=0.94, p=0.333), meaning that knowing today's VIX does not reliably predict tomorrow's volume, and vice versa. The relationship is contemporaneous rather than temporally predictive, cautioning against using either variable to forecast the other.
Patterns, Clusters, and Outliers
The data exhibits a notably heteroscedastic pattern — at lower VIX values (roughly 11–16), notional volume clusters tightly in a band between approximately 11–18 trillion, while at higher VIX levels (20+), volume spreads dramatically upward. Several prominent outliers stand out: the points near (10.75B, 26.69) and (10.75B, 22.42) represent days of both elevated VIX and very high volume, likely corresponding to specific market stress events in 2016 (Brexit vote in June, U.S. election in November are prime candidates). Conversely, the point near (6.78B, 11.27) sits at the low extreme of both axes. The bulk of the data concentrates between VIX values of 12–18 and volume of 12–17 trillion, forming a dense core cluster with a modest positive slope — suggesting the positive relationship is largely driven by the relatively sparse high-volatility days pulling the regression line upward.
Confounding Factors and Caveats
Several important caveats apply. Seasonality and calendar effects (e.g., quarter-end rebalancing, holiday-adjacent low-volume days) independently drive both VIX and volume, potentially inflating the measured correlation. Macro event clustering — Brexit, the U.S. presidential election, Federal Reserve announcements — creates discrete volatility-volume spikes that may disproportionately drive the correlation signal. The axes are inverted from the typical analytical framing: VIX is plotted on X and volume on Y, though causality technically runs both ways or from shared underlying market stress. Additionally, Tape A captures only NYSE-listed securities, so the relationship may differ for Tape B (NYSE American) or Tape C (Nasdaq) securities. The N=3,622 population versus n=252 sample also suggests this dataset represents trading days, and any non-random sampling could bias findings.
Actionable Insights and Further Investigation
Practitioners should treat VIX as a rough contemporaneous signal for elevated volume conditions rather than a predictive trigger — the failed Granger tests make this clear. Further investigation should explore non-linear specifications (e.g., logarithmic or quadratic models), since the heteroscedasticity suggests the relationship may accelerate at high VIX levels, potentially offering better fit. It would be valuable to disaggregate by market regime (low volatility: VIX <15; moderate: 15–20; high: 20) to test whether the correlation strengthens meaningfully in stress periods. Researchers should also control for day-of-week, month-end effects, and specific event dates to isolate the true volatility-volume relationship from calendar noise. Finally, extending this analysis across multiple years and incorporating Tape B and C data would reveal whether 2016's unusually event-rich calendar makes this correlation atypically strong or representative of a structural market relationship.
X dataset: Cboe U.S. Equities Historical Market Volume Data 2016
Y dataset: VIX Volatility Index Daily (FRED)
Part of experiment: Daily - Cboe U.S. Equities Historical Market Volume Data 2016 vs VIX Volatility Index Daily (FRED)