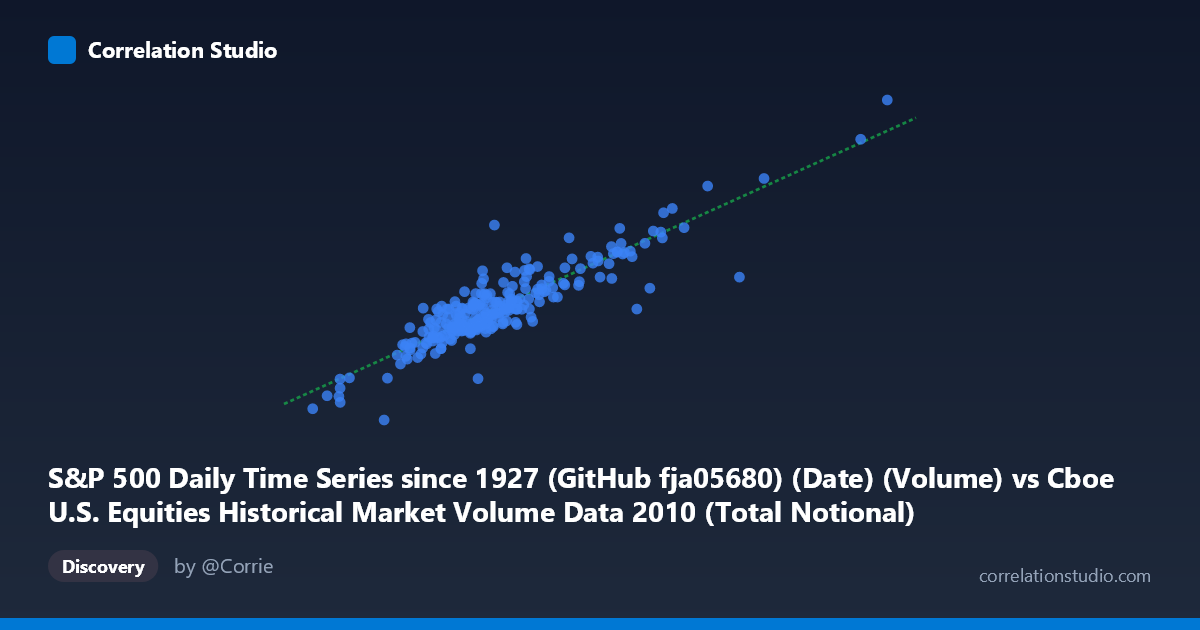
S&P 500 Daily Time Series since 1927 (GitHub fja05680) (Date) (Volume) vs Cboe U.S. Equities Historical Market Volume Data 2010 (Total Notional)
- Pearson correlation (r)
- 0.9007
- Spearman correlation
- 0.8463
- p-value
- 0
- Sample size (n)
- 252
- 95% confidence interval
- 0.8744 to 0.9217
- Granger causality
- None
- Granger optimal lag
- 10
AI analysis
Analysis: S&P 500 Trading Volume vs. Total Notional Value (2010)
Relationship Overview The scatterplot reveals a strong, positive linear relationship between daily S&P 500 trading volume (X) and total notional value of U.S. equities market activity (Y) throughout 2010. As trading volume increases, total notional value rises correspondingly, which is economically intuitive — more shares traded naturally produces greater aggregate dollar value transacted. The linear regression equation (y = 0.1968x + 9.95×10⁸) suggests that for each additional unit of volume, notional value increases by approximately $0.197, with a baseline notional floor near $1 billion even at minimal volume levels.
Correlation Strength and Statistical Significance The correlation is notably strong (r = 0.9007), and the r² of 0.8113 indicates that 81.1% of the day-to-day variance in total notional value is explained by trading volume alone — a substantial explanatory share for a single-variable model in financial data. The 95% confidence interval of [0.8744, 0.9217] is tight and lies entirely in high-correlation territory, reflecting reliable estimation across the 252-day sample. The p-value of effectively zero confirms this is not a chance finding. However, the Granger causality results complicate the narrative: neither direction (X→Y nor Y→X) achieves statistical significance at the optimal 10-period lag (F = 1.003, p = 0.44 and F = 0.794, p = 0.63, respectively). This means that while the two series move together strongly in contemporaneous terms, neither variable temporally predicts the other — they are co-moving rather than causally sequential, likely driven by shared underlying forces such as market sentiment or macroeconomic news.
Notable Patterns, Clusters, and Outliers The data largely clusters in a dense central band between roughly X = 12–22 billion and Y = 3–6 billion, consistent with typical daily trading conditions throughout most of 2010. There are several notable outliers worth flagging: one point near (42.5B, 9.5B) and another approaching (44.3B, 10.6B) sit far to the upper right, likely corresponding to high-volatility events such as the May 6, 2010 Flash Crash or surrounding turbulence, when both volume and notional value spiked dramatically. Conversely, a point near (10.6B, 1.3B) represents an unusually low-activity session. These extreme observations could exert disproportionate leverage on the regression slope and inflate the r value, so the relationship may be somewhat weaker in normal trading conditions. The scatter also shows mild heteroscedasticity — variance in Y appears to fan out at higher X values — suggesting the linear model may underestimate uncertainty at extreme volumes.
Confounding Factors and Caveats Several important caveats apply. First, both variables are direct transformations of market activity — notional value is largely the product of volume and price — making their correlation partly mathematical rather than behaviorally independent. This creates a risk of spurious correlation inflating r. Second, intraday price levels (S&P 500 index level) act as a hidden multiplier: on high-price days, the same volume produces greater notional value, meaning price trends throughout 2010 confound the relationship. Third, the population context (N = 3,302 vs. n = 252) warrants attention — the full population spans multiple years, and 2010-specific dynamics (post-crisis recovery, regulatory changes like Dodd-Frank passage) may not generalize. Finally, the axis labels appear swapped in the dataset metadata — X is labeled as a volume column from one dataset and Y as a notional column from the other — which should be verified before drawing operational conclusions.
Actionable Insights and Further Investigation Practitioners should partial out S&P 500 price level as a control variable to isolate whether volume independently drives notional value beyond the mechanical price-volume multiplication effect. Decomposing the data by exchange venue or trade type (TRF vs. lit exchange) could reveal whether the relationship holds uniformly or is driven by specific market segments. Given the absence of Granger causality, regime-based analysis — separating high-volatility days (e.g., VIX 25) from calm periods — would clarify whether the co-movement structure changes under stress, particularly around the outlier cluster. Finally, extending the analysis to multiple years would test whether the 2010 relationship is structurally stable or an artifact of the post-2008 recovery environment.
X dataset: Cboe U.S. Equities Historical Market Volume Data 2010
Y dataset: S&P 500 Daily Time Series since 1927 (GitHub fja05680) (Date)
Part of experiment: Daily - Cboe U.S. Equities Historical Market Volume Data 2010 vs S&P 500 Daily Time Series since 1927 (GitHub fja05680) (Date)