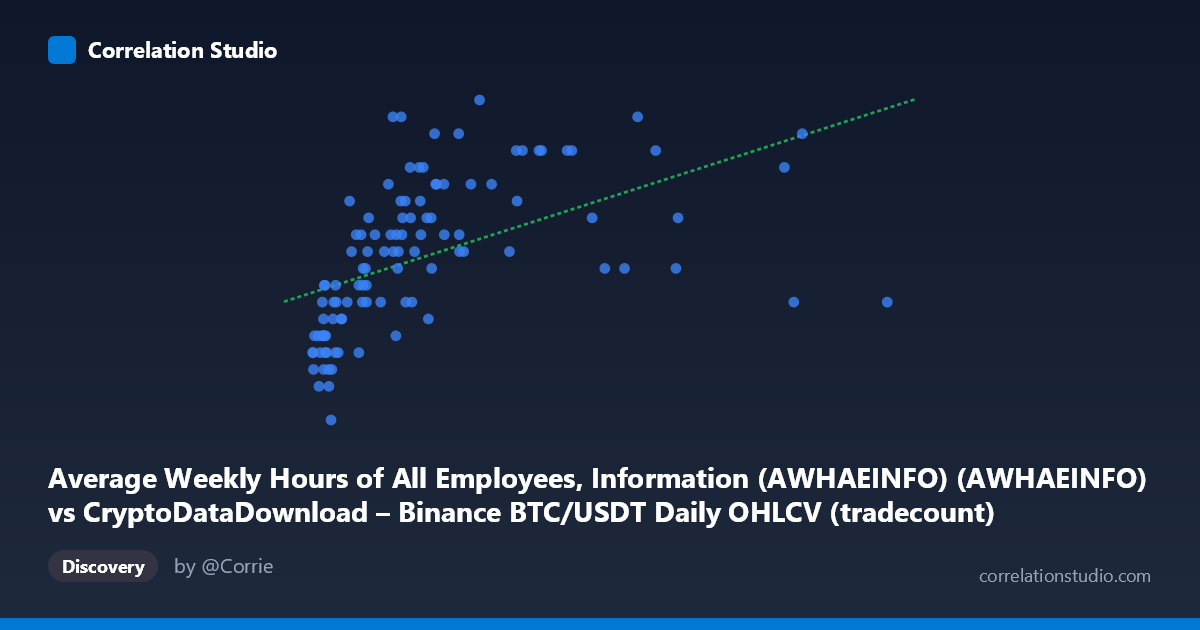
Average Weekly Hours of All Employees, Information (AWHAEINFO) (AWHAEINFO) vs CryptoDataDownload – Binance BTC/USDT Daily OHLCV (tradecount)
- Pearson correlation (r)
- 0.5048
- Spearman correlation
- 0.7346
- p-value
- 0
- Sample size (n)
- 106
- 95% confidence interval
- 0.3476 to 0.6345
- Granger causality
- None
- Granger optimal lag
- 1
AI analysis
Analysis: BTC/USDT Trading Metrics vs. Average Weekly Hours (Information Sector)
1. Relationship Overview
The scatterplot displays a modest positive association between the X-variable (labeled here as Binance BTC/USDT data, though the value range of 4,000–9,390,487 suggests this is likely tradecount or volume rather than price) and Y-variable (Average Weekly Hours in the Information sector, ranging narrowly between 35.7–38.0 hours). As X increases, Y shows a slight upward drift, but the relationship is loose and scattered rather than tightly linear — points cluster densely at lower X-values (under 2 million) with a long, sparse tail extending to higher X-values (up to ~9.4 million).
2. Strength, Direction, and Statistical Meaning
The Pearson correlation of r = 0.486 indicates a moderate positive relationship, but r² = 0.236 reveals that only ~23.6% of the variance in Y is explained by X — meaning over three-quarters of the variability in weekly hours is driven by other factors. The 95% confidence interval [0.324, 0.620] is reasonably tight and entirely positive, and the p-value (1.52E-07) is highly significant, confirming this correlation is not due to chance given the sample size (n=105). However, statistical significance here reflects reliability of the correlation's existence, not its practical strength — a moderate r² still leaves substantial unexplained variance. Critically, the Granger causality tests show no significant predictive direction in either direction (X→Y: p=0.44; Y→X: p=0.79), meaning neither variable's past values help forecast the other over time. This strongly suggests the correlation is not causal or temporally predictive, but likely reflects a shared trend, coincidental co-movement, or mutual dependence on an omitted time-based factor (both series may simply be trending across the 2017–2026 window independently).
3. Notable Patterns and Non-linear Features
The data shows clear heteroscedasticity: dense clustering at low X-values (0–2M) with Y ranging fully across 35.7–38.0, while sparse high-X points (4M) tend to cluster in a narrower Y band (36.4–37.3). This funnel-like pattern, combined with the note that Spearman ρ exceeds Pearson r, indicates the true relationship is likely non-linear — possibly logarithmic, where Y rises quickly at low X and plateaus at higher X. A few high-leverage points (e.g., X≈9.39M, 7.86M, 7.71M) sit far from the bulk of the data and could disproportionately influence the linear fit; a log-transform of X would likely linearize the relationship and improve fit.
4. Confounding Factors and Caveats
This pairing is unusual and warrants scrutiny: BTC/USDT trading activity and U.S. Information-sector average weekly hours are conceptually unrelated markets/sectors. Any correlation is most plausibly a spurious relationship driven by shared temporal trends — both series may be rising over the 2017–2026 period due to independent macro factors (crypto market maturation vs. labor market dynamics), inflating the correlation without genuine causal linkage. Additionally, mismatched frequencies (daily crypto data vs. monthly labor statistics) mean aggregation/interpolation choices could introduce artifacts. The lack of Granger causality reinforces that this is likely a coincidental trend correlation, not a functional relationship.
5. Recommendations
Given the non-causal Granger result and low practical variance explained, this correlation should not be used for predictive or trading purposes. To investigate further: (1) test a log or polynomial transformation of X to confirm the non-linear fit implied by the Spearman/Pearson discrepancy; (2) de-trend both series (e.g., first-differencing) to check if the correlation persists after removing shared time trends — if it vanishes, this confirms spurious correlation; (3) verify the actual column mapping/units for X, as the axis label mismatch (BTC OHLCV vs. AWHAEINFO) suggests possible data-pipeline errors that should be resolved before further analysis.
X dataset: CryptoDataDownload – Binance BTC/USDT Daily OHLCV
Y dataset: Average Weekly Hours of All Employees, Information (AWHAEINFO)
Part of experiment: Bitcoin - CryptoDataDownload – Binance BTC/USDT Daily OHLCV vs Average Weekly Hours of All Employees, Information (AWHAEINFO)