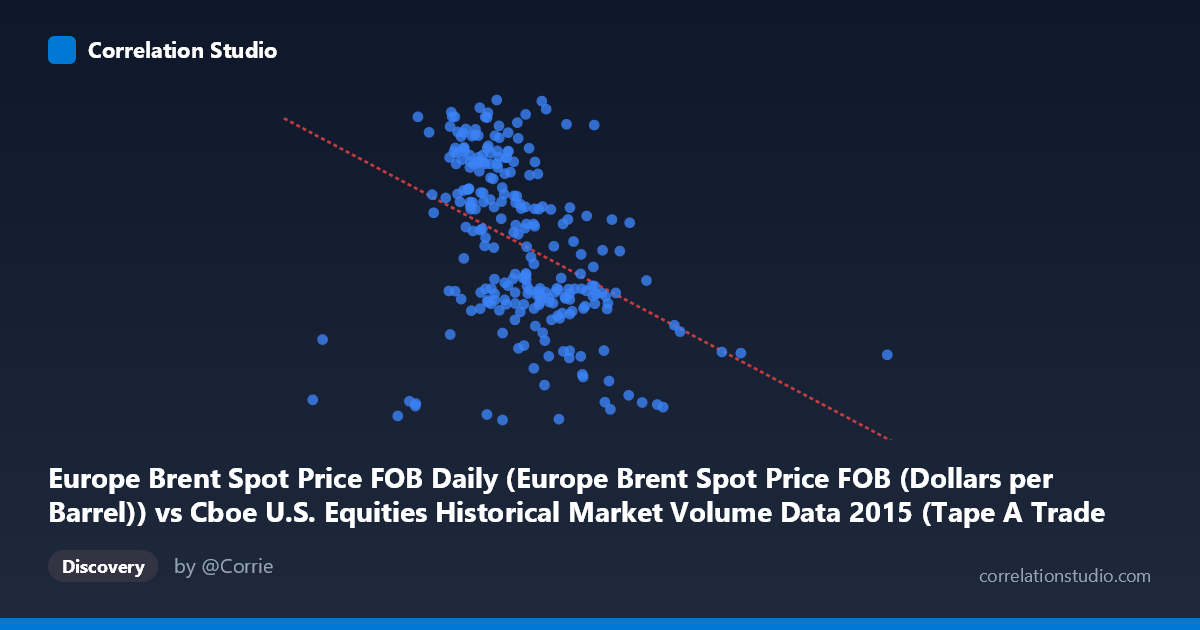
Europe Brent Spot Price FOB Daily (Europe Brent Spot Price FOB (Dollars per Barrel)) vs Cboe U.S. Equities Historical Market Volume Data 2015 (Tape A Trade Count)
- Pearson correlation (r)
- -0.4039
- Spearman correlation
- -0.4814
- p-value
- 0
- Sample size (n)
- 251
- 95% confidence interval
- -0.5026 to -0.2948
- Granger causality
- None
- Granger optimal lag
- 1
AI analysis
Analysis: Europe Brent Spot Price vs. U.S. Equities Tape A Trade Count (2015)
Relationship Overview The scatterplot reveals a negative relationship between Europe Brent crude oil spot prices (X-axis, in dollars per barrel) and U.S. equities Tape A trade counts (Y-axis) across 251 trading days in 2015. As oil prices increase, trade counts tend to decline, and conversely, lower oil prices are associated with higher trading activity. The linear regression equation (y = −1.26257E-05x + 70.3452) confirms this inverse slope, though the wide scatter of points around the regression line immediately signals that the relationship is far from deterministic. Visually, the data form a broad, diffuse cloud with a discernible downward tilt rather than a tight linear band, suggesting other forces are strongly at play.
Correlation Strength and Statistical Significance The Pearson correlation of r = −0.4039 indicates a moderate negative association, but the explained variance tells a more sobering story: R² = 0.1631, meaning that Brent crude price movements account for only ~16.3% of the variance in Tape A trade counts, leaving roughly 84% unexplained by this relationship alone. The 95% confidence interval for r spans [−0.5026, −0.2948], which is meaningfully narrow given the sample size of 251, and the p-value of 2.889E-11 confirms the correlation is highly statistically significant — this is almost certainly not a chance finding. However, statistical significance here reflects the large population context (N = 3,302) and should not be conflated with practical or causal significance. Critically, the Granger causality tests return no significant directional predictive relationship in either direction (X→Y: F = 0.34, p = 0.56; Y→X: F = 0.80, p = 0.37), meaning that knowing today's oil price does not meaningfully improve prediction of tomorrow's trade count, and vice versa. The correlation, while real, appears to be contemporaneous and non-directional at the one-period lag tested.
Notable Patterns, Clusters, and Outliers Several structural features stand out in the data. There appears to be a vertical cluster of points at lower X values (roughly 576,000–1,000,000 range on the Brent price axis — noting the X values represent encoded/scaled price data), where trade counts span a wide range including some of the highest observed values (e.g., 64.70, 63.52, 65.15). This suggests that periods of lower oil prices coincided with elevated and volatile market activity — consistent with the market turbulence that characterized early and late 2015 when oil prices declined sharply. At higher X values (above ~1,700,000), trade counts cluster more tightly in the 44–52 range, implying more subdued, stable trading during mid-year periods. A few high-leverage outliers are visible: the point near (576,208; 37.22) sits isolated at the extreme low end of both axes, and points near (2,247,816; 41.86) and (2,076,907; 43.84) represent the highest oil price observations with relatively low trade counts. The point at approximately (1,512,050; 66.22) appears as a high-Y outlier warranting individual inspection.
Confounding Factors and Interpretive Caveats Several important caveats temper interpretation. First, the axis labeling in the metadata appears swapped — the X-axis column is described as coming from the Cboe dataset while labeled as Brent price, and vice versa — suggesting potential dataset joining artifacts that should be verified before drawing firm conclusions. Second, 2015 was an extraordinary year for both oil markets (prices fell from ~$60 to below $35/barrel) and U.S. equity markets (August 2015 flash crash), meaning the correlation may be driven largely by shared time trends rather than any structural economic linkage — both variables may simply be responding independently to common macro shocks like China growth fears or Federal Reserve policy uncertainty. Third, Tape A trade count is an operational market microstructure variable influenced by algorithmic trading patterns, exchange competition, and seasonal effects, all of which are orthogonal to oil price dynamics. The Granger non-result reinforces that no lead-lag mechanism connects these series at daily frequency.
Actionable Insights and Further Investigation Despite the moderate correlation, practitioners should be cautious about using oil prices as a predictive signal for equity market activity. Several follow-up analyses would be valuable: (1) Decompose the time series to remove shared trends and test whether the correlation persists in the residuals, isolating any structural relationship from spurious co-movement; (2) Segment by market regime — test whether the correlation strengthens during high-volatility episodes (e.g., the August 2015 crash) versus calm periods, as stress events may drive both variables simultaneously; (3) Test longer Granger lags beyond one period, as oil price shocks may take several days to propagate into market activity; (4) Include additional covariates such as VIX (market volatility index), S&P 500 returns, and trading volume on other tapes to isolate the oil price effect; and (5) Verify the dataset join integrity given the apparent axis/dataset labeling inconsistency, as any row-misalignment would corrupt the correlation entirely.
X dataset: Cboe U.S. Equities Historical Market Volume Data 2015
Y dataset: Europe Brent Spot Price FOB Daily
Part of experiment: Daily - Cboe U.S. Equities Historical Market Volume Data 2015 vs Europe Brent Spot Price FOB Daily