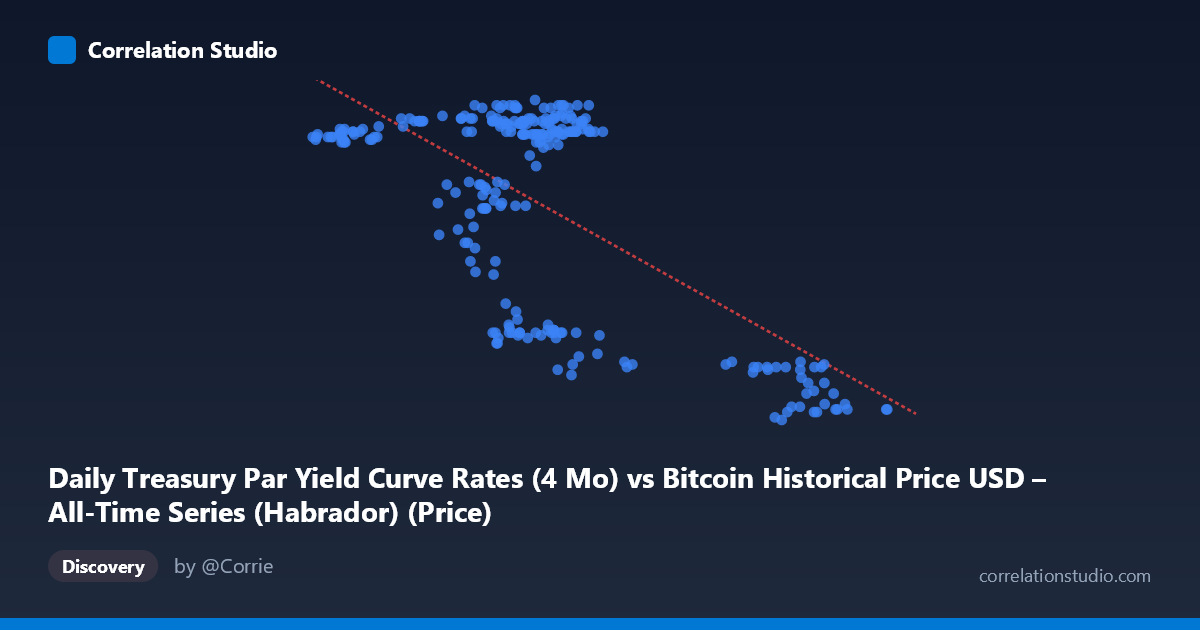
Daily Treasury Par Yield Curve Rates (4 Mo) vs Bitcoin Historical Price USD – All-Time Series (Habrador) (Price)
- Pearson correlation (r)
- -0.6625
- Spearman correlation
- -0.3394
- p-value
- 0
- Sample size (n)
- 250
- 95% confidence interval
- -0.7269 to -0.5867
- Granger causality
- None
- Granger optimal lag
- 1
- Time coverage
- 2024-01-02 to 2024-12-31
AI analysis
Analysis: Treasury 4-Month Yield vs. Bitcoin Price
Note on axis labeling: The axis labels appear swapped in the metadata—X is described as the 4-month Treasury yield but ranges 39,507–105,990 (clearly Bitcoin price in USD), while Y ranges 4.32–5.53 (clearly a yield in percentage terms). The analysis below treats X as Bitcoin price and Y as the 4-month Treasury yield, consistent with the actual data ranges.
1. Relationship Overview The scatterplot shows a moderate-to-strong negative relationship: as Bitcoin price rises, the 4-month Treasury yield tends to fall. The data cluster into two visually distinct regimes rather than following a smooth continuous line—one cluster around X≈57,000–70,000 with Y≈5.1–5.5, and another around X≈87,000–101,000 with Y≈4.3–4.5. This bimodal clustering suggests the relationship may be driven by a regime shift over time rather than a continuous functional dependency.
2. Strength, Direction, and Statistical Confidence The correlation coefficient (r = -0.6625) indicates a moderately strong inverse relationship, with r² = 0.4389 meaning only 44% of the variance in Treasury yields is explained by Bitcoin price—leaving the majority (56%) unexplained by this bivariate relationship alone. The 95% CI [-0.7269, -0.5867] is reasonably tight and excludes zero, and the p-value ≈ 0 confirms this correlation is highly unlikely due to chance. However, statistical significance should not be conflated with strong predictive power given the r² ceiling. Critically, the Granger causality tests show no significant temporal predictive direction (X→Y: p=0.38; Y→X: p=0.34). This means neither variable helps forecast the other's future values based on past values—the correlation is likely driven by both series independently trending over 2024 (e.g., both responding to a common macro factor like Fed policy expectations) rather than one causing the other.
3. Notable Patterns and Clusters The data reveals at least two tight clusters rather than a linear continuum: - Cluster A (majority of points): Bitcoin ~57,000–70,000, yields ~5.1–5.5% - Cluster B (minority, ~10-15% of points): Bitcoin ~87,000–101,000, yields ~4.3–4.5%
This bimodality suggests a step-change or threshold effect—likely corresponding to a specific period (e.g., late 2024) when yields fell sharply as Bitcoin rallied past $90k, rather than a smooth inverse relationship holding throughout the year. The apparent "outliers" (high-price/low-yield points) are actually a coherent sub-cluster, not statistical anomalies.
4. Confounding Factors and Caveats This is a classic case of spurious correlation via a common time trend. Both Bitcoin price and short-term Treasury yields were likely influenced independently in 2024 by: - Federal Reserve rate-cut expectations/actions (directly driving down the 4-month yield, and indirectively boosting risk assets like Bitcoin via lower discount rates and improved liquidity) - General 2024 bull market conditions in risk assets - Time itself as a confound—since both series trend monotonically over the year, any two trending time series will show correlation without genuine bivariate dependency
The lack of Granger causality strongly supports interpreting this as correlation without causation—both are likely responding to the same underlying monetary policy cycle rather than one directly influencing the other.
5. Recommendations for Further Investigation - Decompose by time: Plot both series against date (not against each other) to confirm whether the "relationship" is really just two co-trending series across 2024's rate-cut cycle. - Control for the common driver: Include a Fed Funds rate or FOMC meeting dates as a third variable; partial correlation controlling for policy rate changes would clarify whether the Bitcoin-yield link is direct or mediated. - Segment the clusters: Analyze Cluster A and Cluster B separately (e.g., pre/post a specific date) to see if the relationship holds within regimes or is purely an artifact of a discrete shift. - Avoid using this for trading/forecasting: Given no Granger causality, this correlation should not be used to predict Treasury yields from Bitcoin prices (or vice versa) in a forecasting model.
X dataset: Bitcoin Historical Price USD – All-Time Series (Habrador)
Y dataset: Daily Treasury Par Yield Curve Rates
Part of experiment: Bitcoin - Bitcoin Historical Price USD – All-Time Series (Habrador) vs Daily Treasury Par Yield Curve Rates