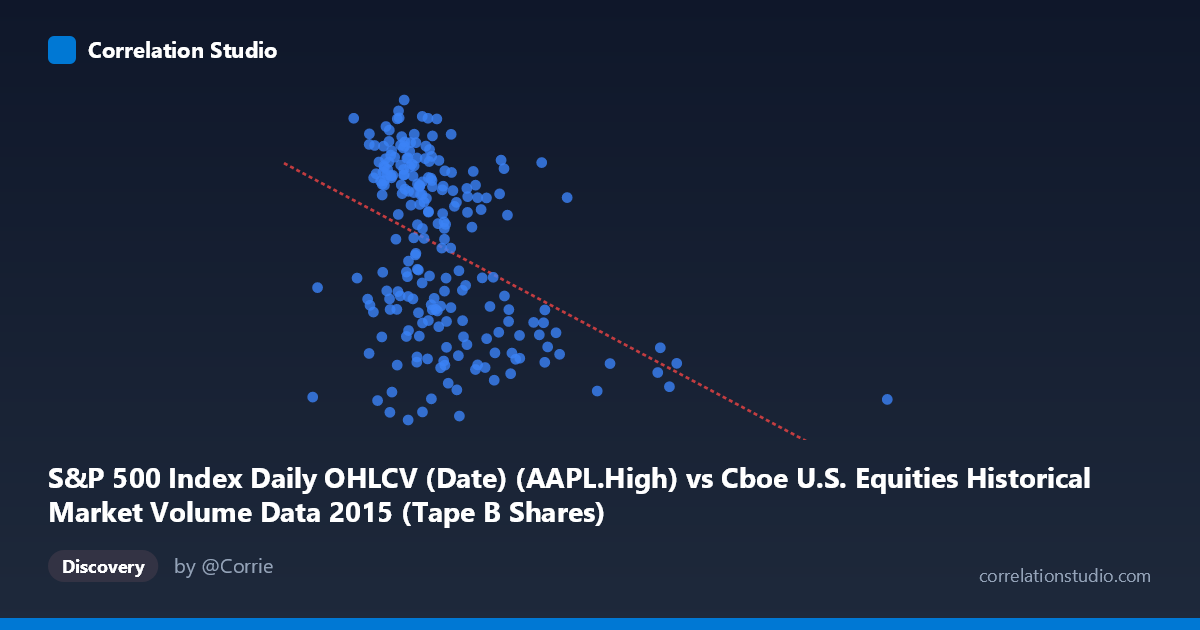
S&P 500 Index Daily OHLCV (Date) (AAPL.High) vs Cboe U.S. Equities Historical Market Volume Data 2015 (Tape B Shares)
- Pearson correlation (r)
- -0.4017
- Spearman correlation
- -0.4135
- p-value
- 0
- Sample size (n)
- 222
- 95% confidence interval
- -0.5066 to -0.2851
- Granger causality
- None
- Granger optimal lag
- 1
AI analysis
Scatterplot Analysis: AAPL High Price vs. Cboe Tape B Shares Volume
Relationship Overview The scatterplot reveals a negative relationship between Apple's daily high price (X-axis) and Cboe U.S. Equities Tape B shares volume (Y-axis) over the 2015 trading year. As AAPL's daily high price increases, Tape B share volume tends to decrease modestly. The linear regression equation (y = -9.82×10⁻⁸x + 132.144) reflects this downward slope, though the scatter around the regression line is considerable, suggesting the relationship is real but far from deterministic. Most data points cluster in the AAPL high price range of roughly $70M–$160M (in raw index units) with Tape B volumes between approximately 110 and 133, while a handful of points extend into much higher price territory with notably lower volume readings.
Correlation Strength and Statistical Significance The Pearson correlation of r = -0.40 indicates a moderate negative association, but the explanatory power is limited: r² = 0.161, meaning only about 16% of the variance in Tape B share volume is explained by AAPL's high price. The remaining 84% is attributable to other factors entirely. The 95% confidence interval of [-0.507, -0.285] is entirely negative and does not cross zero, and the p-value of 5.12×10⁻¹⁰ confirms this is highly statistically significant — the negative correlation is almost certainly not a sampling artifact given n = 222. However, statistical significance should not be confused with practical importance; a 16% explained variance is modest at best. Critically, the Granger causality tests show no significant predictive directionality in either direction (X→Y: F = 0.78, p = 0.378; Y→X: F = 1.02, p = 0.314), meaning that knowing AAPL's high price today does not help predict tomorrow's Tape B volume, and vice versa. This absence of temporal predictability sharply limits any causal interpretation.
Notable Patterns, Clusters, and Outliers The data exhibits a dense core cluster concentrated between AAPL highs of roughly $70M–$130M and Tape B volumes of 115–133, where the negative trend is most visible. There is a notable right-tail outlier at approximately x = 312M with a Tape B volume near 109 — a point that appears substantially removed from the main cluster and likely exerts disproportionate leverage on the regression slope. Several additional points in the $140M–$210M range also show lower-than-average Tape B readings, reinforcing the negative slope. There is also visible vertical spread at similar X values (e.g., multiple points near x = 85–95M span from ~114 to ~134 in Y), suggesting high conditional variance and possible omitted variables or regime differences within the year.
Confounding Factors and Caveats Several important caveats apply. First, dataset labeling appears inverted — the X-axis is described as originating from "Cboe U.S. Equities" data but labeled as AAPL High, while the Y-axis is described as originating from "S&P 500 OHLCV" data but labeled as Tape B Shares; this metadata inconsistency warrants careful verification before drawing conclusions. Second, the negative correlation may largely reflect temporal co-movement in 2015: AAPL peaked early in 2015 and declined through the summer correction, while market volumes tend to spike during volatility events — meaning both series may be independently responding to broader market stress rather than causally influencing each other. Third, Tape B volumes (NASDAQ-listed securities traded on non-primary venues) are driven by structural market microstructure factors, exchange competition, and fragmentation dynamics that have little fundamental connection to AAPL's price level. Finally, the wide confidence interval and the Granger results together suggest the correlation may be spurious or coincidental, driven by overlapping 2015 market events such as the August correction.
Actionable Insights and Further Investigation Given the modest explanatory power and absent Granger causality, practitioners should avoid using AAPL price levels as a direct predictor of Tape B volume. Further investigation should include: (1) controlling for VIX or realized volatility as a potential common driver of both series; (2) segmenting the time series into pre- and post-August 2015 correction periods to test whether the correlation is regime-dependent; (3) investigating the outlier at x ≈ 312M to determine whether it represents a data error or a genuine extreme event; and (4) running a multiple regression incorporating broader market volume, S&P 500 returns, and volatility measures to assess whether the AAPL-Tape B relationship survives proper controls. The metadata discrepancy should be resolved first to ensure the correct variables are actually being analyzed.
X dataset: Cboe U.S. Equities Historical Market Volume Data 2015
Y dataset: S&P 500 Index Daily OHLCV (Date)
Part of experiment: Daily - Cboe U.S. Equities Historical Market Volume Data 2015 vs S&P 500 Index Daily OHLCV (Date)