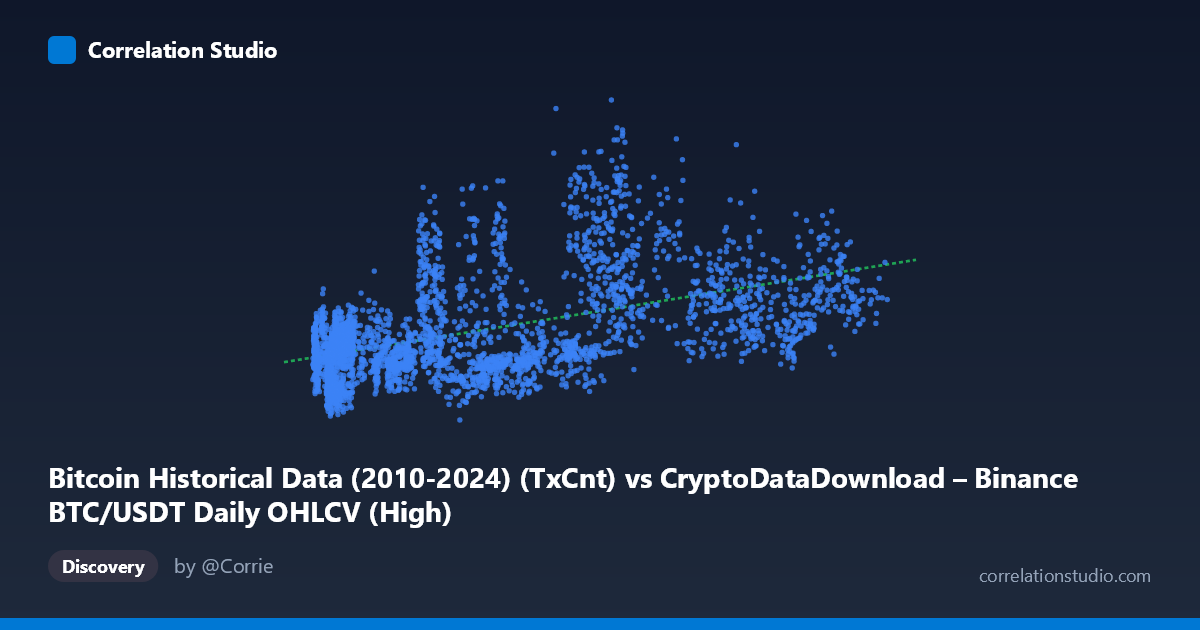
Bitcoin Historical Data (2010-2024) (TxCnt) vs CryptoDataDownload – Binance BTC/USDT Daily OHLCV (High)
- Pearson correlation (r)
- 0.5005
- Spearman correlation
- 0.5041
- p-value
- 0
- Sample size (n)
- 3191
- 95% confidence interval
- 0.474 to 0.5261
- Granger causality
- None
- Granger optimal lag
- 10
AI analysis
Analysis: Bitcoin Transaction Count vs. Price (High)
1. Relationship Overview
The scatterplot depicts the relationship between Bitcoin's daily transaction count (X-axis) and its daily high price (Y-axis) on Binance from 2017–2026. The data shows a positive but noisy relationship — as transaction counts increase, prices tend to rise, but with substantial scatter. The sample points illustrate this well: low transaction counts (3,000–15,000) correspond to a wide price range (~130,000–400,000), while higher transaction counts (80,000–110,000) tend to cluster in the 400,000–550,000 price range, though with notable exceptions (e.g., 42,899 transactions paired with 724,837 price).
2. Strength, Direction, and Statistical Confidence
The correlation coefficient (r = 0.50) indicates a moderate positive relationship, but r² = 0.2505 reveals that transaction count explains only 25% of the variance in price — leaving 75% attributable to other factors. The 95% CI [0.474, 0.526] is tight given the large sample (n=3,191), and the p-value ≈ 0 confirms this correlation is highly statistically significant and not due to chance. However, statistical significance ≠ practical strength — with only a quarter of variance explained, transaction count alone is a weak predictor of price.
Critically, the Granger causality tests show no significant predictive direction in either direction (X→Y: p=0.63; Y→X: p=0.87) at the optimal lag of 10 periods. This means neither variable reliably "leads" the other in a time-series forecasting sense — the correlation appears to be contemporaneous/structural (both driven by common market conditions) rather than one causing or predicting the other over time.
3. Notable Patterns and Outliers
The scatter suggests a fan-shaped/heteroskedastic pattern: variance in price increases as transaction count grows, rather than a tight linear band. Several points stand out as outliers relative to the regression line (y = 1.90x + 274,772): - (42,899, 724,837) — high price with only moderate transaction count, likely from a bull-market period (e.g., 2020–2021) where price surged independent of on-chain activity - (3,872.66, 336,764) — very low transaction count with a mid-range price, possibly reflecting later years when transaction count dynamics shifted (SegWit, Lightning Network adoption reducing on-chain tx count without reducing price)
This suggests the X-Y relationship is not stable across time — the price-per-transaction ratio likely shifted structurally across market cycles (2017 bull run, 2018-19 bear, 2020-21 bull, 2022 crash), which would inflate scatter and dampen the linear r².
4. Confounding Factors and Caveats
Several caveats apply: - Time-series non-stationarity: Both Bitcoin price and transaction count trend upward over time independently (adoption growth, inflation of USD price), which can create spurious correlation via shared time trends rather than genuine interaction. - Regime changes: Transaction count is affected by block size limits, fee markets, and layer-2 adoption (Lightning Network) — meaning the same "true" economic activity could produce very different tx counts in 2017 vs. 2024. - Omitted variables: Price is driven by macro factors (interest rates, ETF flows, regulatory news, USDT liquidity) that have nothing to do with on-chain transaction volume. - Granger non-causality doesn't rule out causality — it only tests linear predictive power at daily/lag-10 granularity; causal effects may operate at different lags or through nonlinear channels.
5. Actionable Insights
- Don't use transaction count alone as a price predictor — given no Granger causality and only 25% variance explained, more robust models should incorporate additional features (trading volume, active addresses, exchange netflows, macro indicators). - De-trend or difference the series before further correlation analysis to rule out spurious trend-driven correlation — examine correlation of returns or growth rates rather than levels. - Segment analysis by market regime (bull/bear/sideways) to check if the r² and slope are stable or regime-dependent; this could reveal whether the relationship strengthens during specific phases (e.g., speculative bull runs). - Test alternative lag structures and nonlinear models (e.g., log-log transformation, given Bitcoin's exponential price growth) to see if a nonlinear specification improves explanatory power beyond the current 25%.
X dataset: CryptoDataDownload – Binance BTC/USDT Daily OHLCV
Y dataset: Bitcoin Historical Data (2010-2024)
Part of experiment: Bitcoin - CryptoDataDownload – Binance BTC/USDT Daily OHLCV vs Bitcoin Historical Data (2010-2024)