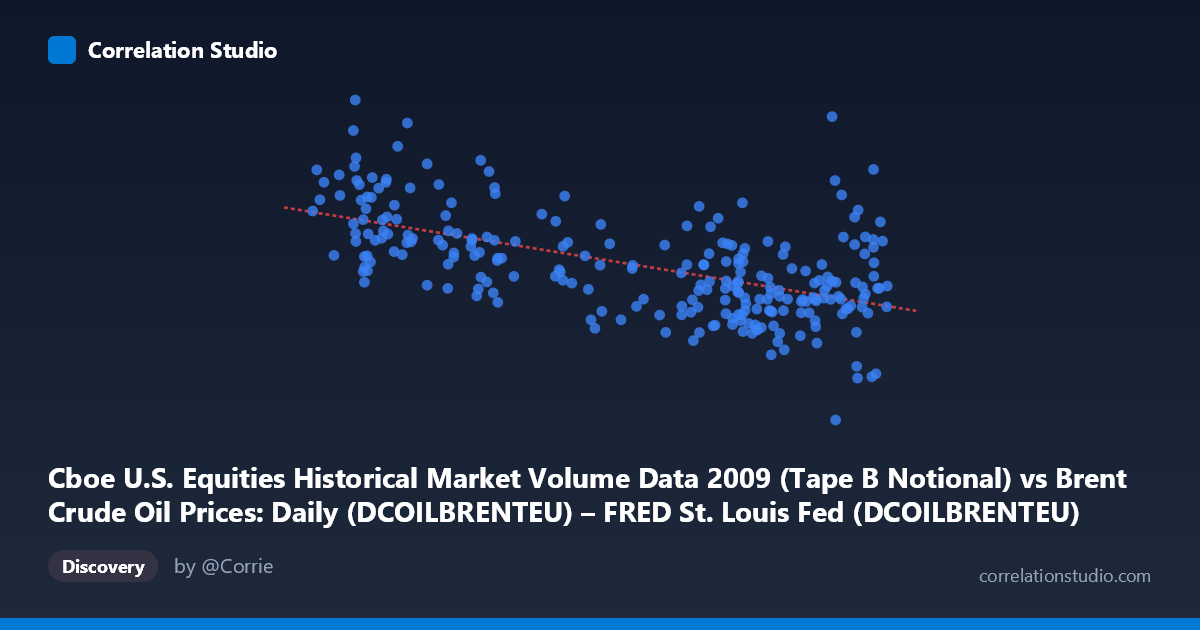
Cboe U.S. Equities Historical Market Volume Data 2009 (Tape B Notional) vs Brent Crude Oil Prices: Daily (DCOILBRENTEU) – FRED St. Louis Fed (DCOILBRENTEU)
- Pearson correlation (r)
- -0.5775
- Spearman correlation
- -0.5392
- p-value
- 0
- Sample size (n)
- 252
- 95% confidence interval
- -0.6544 to -0.4888
- Granger causality
- X → Y
- Granger optimal lag
- 10
AI analysis
Scatterplot Analysis: Brent Crude Oil Price vs. Cboe Tape B Notional Volume (2009)
Relationship Overview
The scatterplot reveals a moderate negative relationship between daily Brent crude oil prices (X-axis, USD/barrel) and Cboe U.S. Equities Tape B notional trading volume (Y-axis). As crude oil prices increase, equity market notional volume tends to decline, and vice versa. The linear regression equation (y = -6.13×10⁷x + 9.056×10⁹) quantifies this inverse slope: for every $1/barrel increase in Brent crude, Tape B notional volume decreases by approximately $61.3 million. Visually, the cloud of points slopes downward from left to right, though with considerable scatter throughout the range, suggesting the relationship is real but far from deterministic.
Correlation Strength and Statistical Significance
The Pearson correlation of r = -0.578 indicates a moderate negative association. However, the explanatory power is more sobering: R² = 0.3335 means only 33.3% of variance in notional volume is explained by crude oil prices, leaving roughly two-thirds of the variation unaccounted for by this single predictor. The 95% confidence interval of [-0.654, -0.489] is relatively tight and does not cross zero, and the p-value of ~0 (against N = 3,232) confirms this is not a chance finding. Critically, the Granger causality analysis indicates a unidirectional relationship: X Granger-causes Y (F = 2.167, p = 0.021) at an optimal lag of 10 trading periods (~2 calendar weeks), while Y does not Granger-cause X (p = 0.227). This suggests crude oil price movements have modest but statistically meaningful predictive power over future equity trading volumes, but not the reverse — a practically important asymmetry for market timing or risk monitoring frameworks.
Notable Patterns, Clusters, and Outliers
Several features stand out in the data. The X-axis spans roughly $39–$79/barrel, and the bulk of the data clusters between $50–$75, reflecting 2009's oil price recovery from the post-financial-crisis lows. There is noticeably greater vertical scatter (volume dispersion) at lower oil price levels (below ~$55/barrel), suggesting equity markets behaved more erratically when crude was cheap and volatile in early 2009. A few conspicuous outliers are visible: the point at (75.15, 1.32×10⁹) represents an unusually low notional volume day despite a relatively high oil price, and (42.19, 8.73×10⁹) represents an extremely high-volume day at a low crude price — possibly coinciding with peak financial crisis volatility in early 2009. The point (75.56, 7.08×10⁹) bucks the trend entirely, showing high volume at a high price, hinting at non-linearity or regime-specific behavior.
Confounding Factors and Interpretive Caveats
This correlation almost certainly reflects shared macroeconomic drivers rather than a direct causal mechanism between crude oil and equity notional volume. The year 2009 was defined by the global financial crisis recovery — risk appetite, institutional deleveraging, and Federal Reserve interventions simultaneously affected both oil prices and equity trading activity. Low oil prices in early 2009 coincided with peak crisis-era trading volumes, while the mid-year recovery in crude correlated with normalizing (lower) trading activity — but both were downstream of broader risk-on/risk-off dynamics. Additionally, Tape B specifically captures regional exchange volume (NYSE American, NYSE Arca, etc.), which may behave differently from total market volume. The 10-period Granger lag, while statistically significant, is modest (F = 2.17), and Granger causality captures predictability, not true economic causation — omitted variables like VIX, S&P 500 returns, or USD/EUR exchange rates likely mediate or confound this relationship substantially.
Actionable Insights and Further Investigation
Practitioners monitoring equity market liquidity conditions could incorporate crude oil price trends as a lagged signal (approximately 2 weeks) for anticipating shifts in notional trading volumes, particularly during periods of macroeconomic stress. However, given the limited R², this should be one component of a multivariate model rather than a standalone predictor. Further investigation should include: (1) adding VIX and broad equity index returns as covariates to isolate the crude oil effect net of general risk sentiment; (2) testing whether the relationship holds in other years or is specific to the 2009 crisis/recovery regime; (3) examining non-linear specifications (e.g., spline regression) given the heteroscedasticity visible at lower price levels; and (4) exploring whether the Granger relationship strengthens during high-volatility subperiods, which could make it more operationally useful for short-term trading volume forecasting.
X dataset: Brent Crude Oil Prices: Daily (DCOILBRENTEU) – FRED St. Louis Fed
Y dataset: Cboe U.S. Equities Historical Market Volume Data 2009
Part of experiment: Daily - Brent Crude Oil Prices: Daily (DCOILBRENTEU) – FRED St. Louis Fed vs Cboe U.S. Equities Historical Market Volume Data 2009