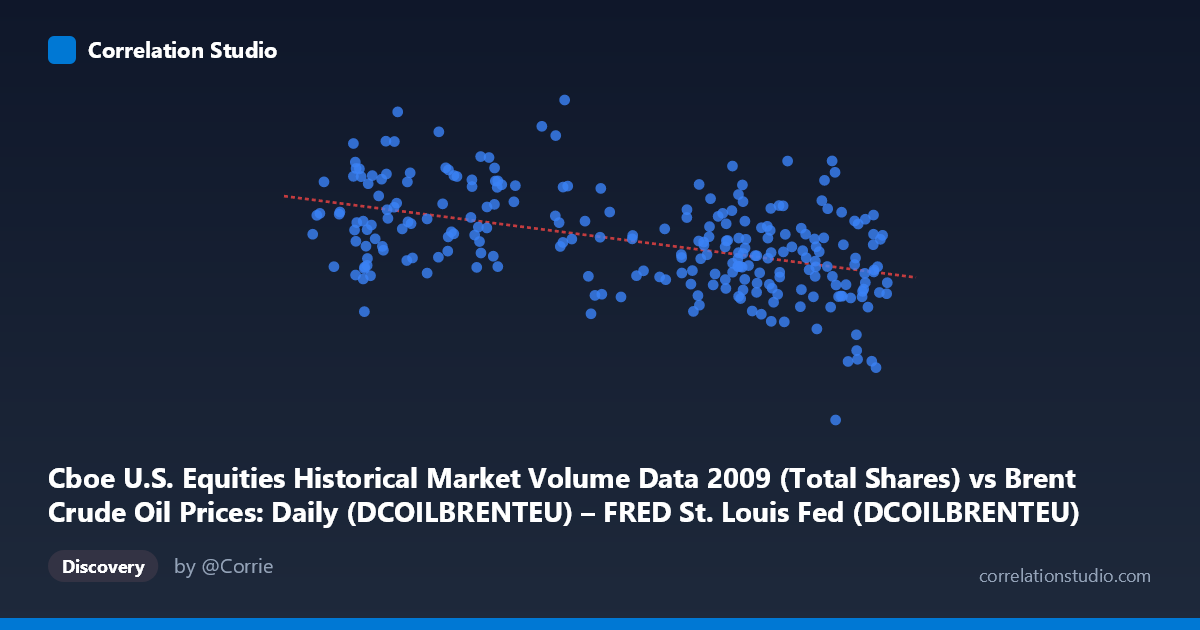
Cboe U.S. Equities Historical Market Volume Data 2009 (Total Shares) vs Brent Crude Oil Prices: Daily (DCOILBRENTEU) – FRED St. Louis Fed (DCOILBRENTEU)
- Pearson correlation (r)
- -0.4765
- Spearman correlation
- -0.4574
- p-value
- 0
- Sample size (n)
- 252
- 95% confidence interval
- -0.5667 to -0.375
- Granger causality
- None
- Granger optimal lag
- 10
AI analysis
Analysis: Cboe U.S. Equities Market Volume vs. Brent Crude Oil Prices (2009)
Relationship Overview
The scatterplot reveals a moderate negative relationship between Cboe U.S. equities total shares traded (X-axis) and Brent crude oil prices (Y-axis) across 252 trading days in 2009. As equity market volume increases, crude oil prices tend to decrease, following the linear regression equation y = -6,004,780x + 1,130,970,000. Visually, the data points form a broadly downward-sloping cloud, though with considerable dispersion around the regression line, suggesting the relationship is real but far from deterministic. The wide Y-range — stretching from roughly $192 million to $1.21 billion — compared to the relatively contained X-range hints at substantial volatility in oil prices independent of equity volume dynamics during this particular year.
Correlation Strength, Direction, and Statistical Significance
The Pearson correlation of r = -0.4765 indicates a moderate negative association, statistically highly significant (p = 1.11×10⁻¹⁵), which effectively rules out chance as an explanation given the sample of 252 paired observations drawn from a population of N = 3,232. However, r² = 0.2271 tells the more sobering story: only about 22.7% of the variance in crude oil prices is explained by equity trading volume, meaning roughly 77.3% of price variation is driven by other factors entirely. The 95% confidence interval for r of [-0.5667, -0.3750] is reassuringly narrow and sits entirely in negative territory, confirming directional consistency, though the width of the interval (~0.19) does reflect meaningful uncertainty about the precise magnitude of the effect. Critically, the Granger causality tests find no significant predictive directionality in either direction (X→Y: F = 1.49, p = 0.14; Y→X: F = 1.72, p = 0.08) at the optimal 10-period lag. This means that while a contemporaneous correlation exists, neither variable reliably leads the other in a temporally predictive sense — a crucial caveat for any practical forecasting application.
Notable Patterns, Clusters, and Outliers
Several features stand out in the data. There is a notable cluster of high-volume, lower-price observations at the upper end of the X-axis (volumes roughly 70–78 million shares), where oil prices appear compressed into a lower range, broadly consistent with the negative slope. Conversely, lower trading volumes (40–55 million shares) are associated with a wider dispersion of oil prices, including several extreme high values. Three points deserve particular attention as potential outliers: the observation at approximately (75.15, 192,269,942.50) sits dramatically below the regression line — nearly 570 million below the mean Y value — and likely corresponds to a specific market disruption event; similarly, (56.63, 1,212,524,830.85) anchors the upper extreme of Y. The point (77.62, 379,662,075.92) also sits well below expectations for its X value. These outliers, especially the extreme low near x = 75, exert meaningful leverage on the regression fit and may disproportionately influence the r value.
Confounding Factors and Interpretive Caveats
The year 2009 was historically exceptional — markets were recovering from the 2008 financial crisis, with Brent crude having collapsed from ~$147/barrel in mid-2008 to under $40 by early 2009 before recovering strongly. This means the observed correlation likely reflects shared macro-financial stress responses rather than any direct mechanical link between equity volume and oil pricing. High equity trading volume in crisis periods often reflects panic selling and deleveraging, which coincides with depressed commodity prices — a classic spurious correlation through a common cause (risk sentiment, credit conditions, institutional behavior). Additionally, the axes appear mislabeled relative to typical conventions: the dataset descriptions suggest oil price should logically be on X and volume on Y, but the analysis proceeds as labeled. Furthermore, with an optimal Granger lag of 10 periods, the absence of predictive causality should temper any interpretation that one variable drives the other.
Actionable Insights and Further Investigation
Despite explaining only ~23% of variance, the negative correlation is robust enough to warrant further investigation into the shared risk-sentiment mechanism. Analysts should consider: (1) incorporating a volatility index (VIX) as a mediating variable to test whether risk appetite fully accounts for the observed correlation; (2) segmenting the 2009 data into pre- and post-recovery phases (roughly splitting around March 2009 when markets bottomed) to test whether the correlation is driven primarily by the crisis phase; (3) investigating the three extreme outliers by matching them to specific macro events (e.g., OPEC announcements, Fed interventions); and (4) extending the analysis to multiple years to determine whether the negative correlation is a stable structural feature or a 2009-specific artifact. Given the absence of Granger causality, this relationship is better suited as a coincident indicator framework than a predictive trading signal without additional variables.
X dataset: Brent Crude Oil Prices: Daily (DCOILBRENTEU) – FRED St. Louis Fed
Y dataset: Cboe U.S. Equities Historical Market Volume Data 2009
Part of experiment: Daily - Brent Crude Oil Prices: Daily (DCOILBRENTEU) – FRED St. Louis Fed vs Cboe U.S. Equities Historical Market Volume Data 2009