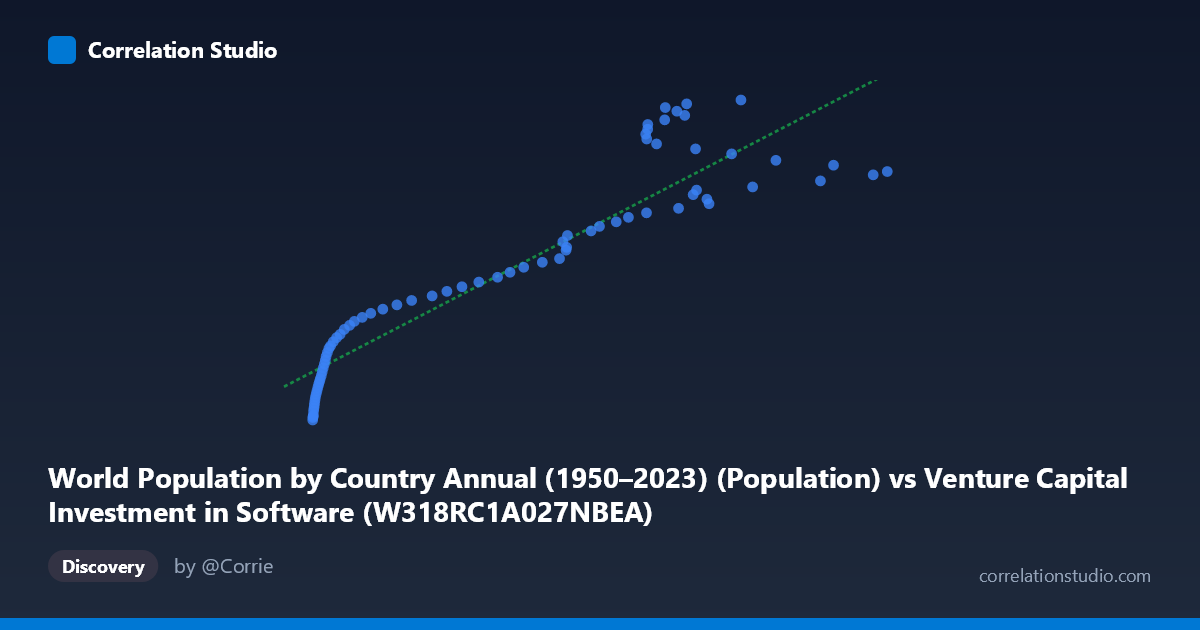
World Population by Country Annual (1950–2023) (Population) vs Venture Capital Investment in Software (W318RC1A027NBEA)
- Pearson correlation (r)
- 0.9243
- Spearman correlation
- 0.9575
- p-value
- 0
- Sample size (n)
- 78
- 95% confidence interval
- 0.8835 to 0.9512
- Granger causality
- None
- Granger optimal lag
- 10
AI analysis
Scatterplot Analysis: World Population vs. Venture Capital Investment in Software
Relationship Overview
The scatterplot reveals a strong positive relationship between world population and venture capital investment in software, with both variables trending upward together across the 1946–2023 time period. As global population increases, VC investment in software rises substantially — from roughly $47–55 million at the lowest population figures to over $160 million at the highest. The linear regression equation (y = 231,583x + 64,715,300) suggests that each unit increase in population corresponds to approximately $231,583 in additional VC software investment, with a substantial baseline intercept reflecting the floor level of investment even at lower population scales.
Correlation Strength and Statistical Interpretation
The correlation is strong and highly statistically significant (r = 0.9243, p ≈ 0), meaning there is virtually zero probability this relationship arose by chance in a sample of n = 78 paired observations. The R² of 0.8543 indicates that approximately 85.4% of the variance in VC software investment is explained by population, which is remarkably high for macroeconomic data. The 95% confidence interval for r [0.8835, 0.9512] is relatively narrow and comfortably distant from zero, reinforcing confidence in the estimate's stability. However, the Granger causality results are notably absent in both directions — X→Y (F = 0.832, p = 0.600) and Y→X (F = 0.785, p = 0.643) both fail to reach significance even at an optimal lag of 10 periods. This is a critical qualifier: despite the strong correlation, neither variable temporally predicts the other in a causal framework, strongly suggesting that both are being driven by a common underlying factor, most plausibly the passage of time itself.
Patterns, Clusters, and Outliers
The data exhibits a broadly linear trend but with notable heteroscedasticity — the spread of Y values fans out considerably at higher X values (population above ~250 units). Several striking clusters are visible: a dense cluster at low X values (roughly 0–50) where many data points converge near the $47M–$87M investment range, and a second, more diffuse cluster in the 250–350 X range where Y values span an unusually wide band from approximately $120M to over $163M. This wide vertical spread in the mid-to-upper population range suggests that population alone does not fully determine investment levels at larger scales — other factors introduce significant variance. A few points near X = 270–305 show particularly high Y values (approaching $160–163M), appearing as modest high-leverage outliers that pull slightly above the regression line.
Confounding Factors and Interpretive Caveats
The most important caveat here is that both variables are time-series that trend upward over the same 1946–2023 period, making spurious correlation through shared temporal trend the dominant interpretive risk. World population has grown monotonically from roughly 2.5 billion to 8 billion over this window, while VC software investment has grown exponentially alongside the broader technology industry's emergence. The absence of Granger causality in either direction strongly corroborates that this is a spurious correlation mediated by time, not a genuine economic mechanism linking population size to software investment. Additional confounders include GDP growth, interest rate cycles, the dot-com boom and bust, the 2008 financial crisis, and the post-2010 smartphone era — all of which independently drive VC flows without any direct connection to population counts.
Actionable Insights and Further Investigation
Researchers should detrend both series (e.g., using first differences or per-capita normalization) before drawing any policy or investment conclusions from this relationship. A more analytically meaningful exercise would be to examine VC software investment as a share of GDP or per capita, which would strip out the common time trend and reveal whether population dynamics genuinely influence investment intensity. Further investigation should incorporate control variables such as interest rates, technology adoption indices, and GDP growth rates in a multivariate regression framework. It would also be valuable to disaggregate by country or region — analyzing whether high-growth population markets (e.g., South and Southeast Asia) attract proportionally more software VC investment — to test whether any genuine population-driven investment mechanism exists beneath the aggregate spurious trend.
X dataset: Venture Capital Investment in Software
Y dataset: World Population by Country Annual (1950–2023)
Part of experiment: Yearly - Venture Capital Investment in Software vs World Population by Country Annual (1950–2023)