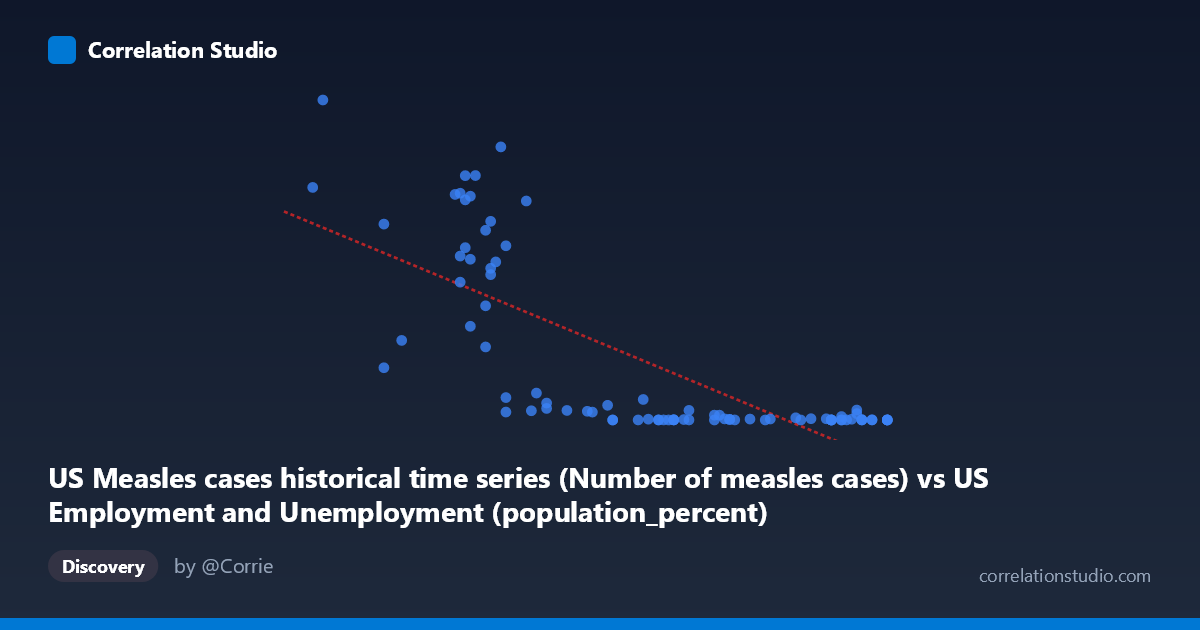
US Measles cases historical time series (Number of measles cases) vs US Employment and Unemployment (population_percent)
- Pearson correlation (r)
- -0.7514
- Spearman correlation
- -0.7808
- p-value
- 0
- Sample size (n)
- 85
- 95% confidence interval
- -0.8314 to -0.6409
- Granger causality
- None
- Granger optimal lag
- 10
AI analysis
Scatterplot Analysis: US Measles Cases vs. Employment Population Percent
Overview of the Relationship
The scatterplot reveals a striking negative relationship between the number of US measles cases (X-axis) and the employment-to-population percentage (Y-axis), spanning data from 1941 to 2025. As measles cases increase, the employment population percentage tends to be lower, and conversely, as measles cases decline toward near-elimination, employment percentages tend to cluster at lower numeric values. At first glance, this inverse pattern appears visually compelling, but the underlying structure of the data — two long-running historical time series both driven by the passage of time — immediately raises fundamental questions about whether this relationship is meaningful or a classic case of spurious temporal correlation.
Correlation Strength, Direction, and Statistical Inference
The Pearson correlation of r = -0.7514 indicates a moderately strong negative linear association, with r² = 0.5646 meaning that approximately 56.5% of the variance in the employment population percentage is statistically "explained" by measles case counts in a linear model. The linear regression equation (y = -59,000.9x + 3,841,580) quantifies this: for every additional measles case, the model predicts a decrease of ~59,001 percentage points in employment — a figure that is numerically nonsensical in practical terms, immediately flagging a unit/scale interpretation problem. The 95% confidence interval for r of [-0.8314, -0.6409] is relatively tight and does not cross zero, and the p-value of 2.22E-16 is extraordinarily small, suggesting the correlation is highly statistically significant. However, statistical significance here reflects the fact that both variables share a common driver — time — rather than any genuine causal link. Crucially, Granger causality tests find no significant predictive direction in either direction (X→Y: F = 0.98, p = 0.47; Y→X: F = 0.88, p = 0.55), meaning that past values of measles cases do not help predict future employment rates, and vice versa. This is a critical finding: even the temporal predictive structure that might hint at a mechanistic relationship is entirely absent.
Notable Patterns, Clusters, and Outliers
The scatterplot reveals a markedly non-linear, heteroscedastic distribution rather than a clean linear relationship. Several structural features stand out:
- High-measles cluster (X: 55.8–61, Y: 100,000–894,000): A dense cluster of points in the upper-left shows extremely high measles case counts associated with a relatively narrow band of employment percentages from the pre-vaccination era (pre-1963). Points like (56.0, 894,134), (59.5, 763,094), and (59.2, 530,118) are dramatic outliers that anchor the regression slope. - Low-measles cluster (X: 62–67, Y: ~13–30,000): A very dense cluster of points in the lower-right reflects the post-vaccination era, where measles cases collapsed to near-zero while employment percentages span a different range. Points like (66.0, 37), (62.8, 86), and (67.1, 85) compress tightly along the bottom. - Intermediate scatter (X: 60–63, Y: 1,000–200,000): A transitional zone spanning the vaccination rollout period shows high variance, suggesting the two variables moved at different rates during this transition. - The Y-axis spans six orders of magnitude (13 to 894,134), strongly suggesting that a log transformation of Y would be more appropriate for linear modeling.
Confounding Factors and Critical Caveats
This correlation is a textbook example of a spurious correlation driven by shared temporal trends. Both variables changed dramatically over the 20th century for entirely independent reasons:
1. Time as the hidden confounder: Measles cases collapsed after the introduction of the measles vaccine in 1963 due to a public health intervention. Employment population percentages changed due to demographic shifts, female labor force participation, economic cycles, and population aging — forces entirely unrelated to infectious disease. 2. Ecological fallacy: These are population-level annual aggregates. No individual-level mechanism connects measles incidence to employment rates. 3. Distributional mismatch: The extreme skewness and heteroscedasticity of Y (stdev of 248,232 against a mean of 161,068) violate linear regression assumptions, making r² misleading as a goodness-of-fit measure. 4. Non-stationarity: Both time series are non-stationary (they have strong trends), which inflates Pearson correlation between any two trending series regardless of subject matter. 5. Scale issues: The regression slope of -59,001 per measles case is dimensionally incoherent, confirming this is a mathematical artifact rather than a substantive finding.
Actionable Insights and Further Investigation
Rather than interpreting this as a meaningful relationship, the analysis points toward several productive directions:
- Detrend both series before computing correlation — regress each variable on time and examine the residuals to remove the shared temporal trend, which would likely substantially reduce or eliminate the observed correlation. - Apply a log transformation to measles case counts (or both variables) to address the severe right-skew and heteroscedasticity before any regression modeling. - Investigate each series independently for its true drivers: measles cases should be modeled against vaccination coverage rates and herd immunity thresholds; employment-to-population ratios should be examined against macroeconomic indicators, demographic composition, and labor policy. - Extend Granger causality testing with detrended, stationary versions of both series at multiple lag structures, as the current result at lag 10 on raw data may be unreliable. - This dataset pair serves as a valuable pedagogical example of how two completely unrelated historical time series can produce high r² and ultra-low p-values purely through shared temporal direction, underscoring the importance of causal reasoning over correlation mining.
X dataset: US Employment and Unemployment
Y dataset: US Measles cases historical time series
Part of experiment: Yearly - US Employment and Unemployment vs US Measles cases historical time series