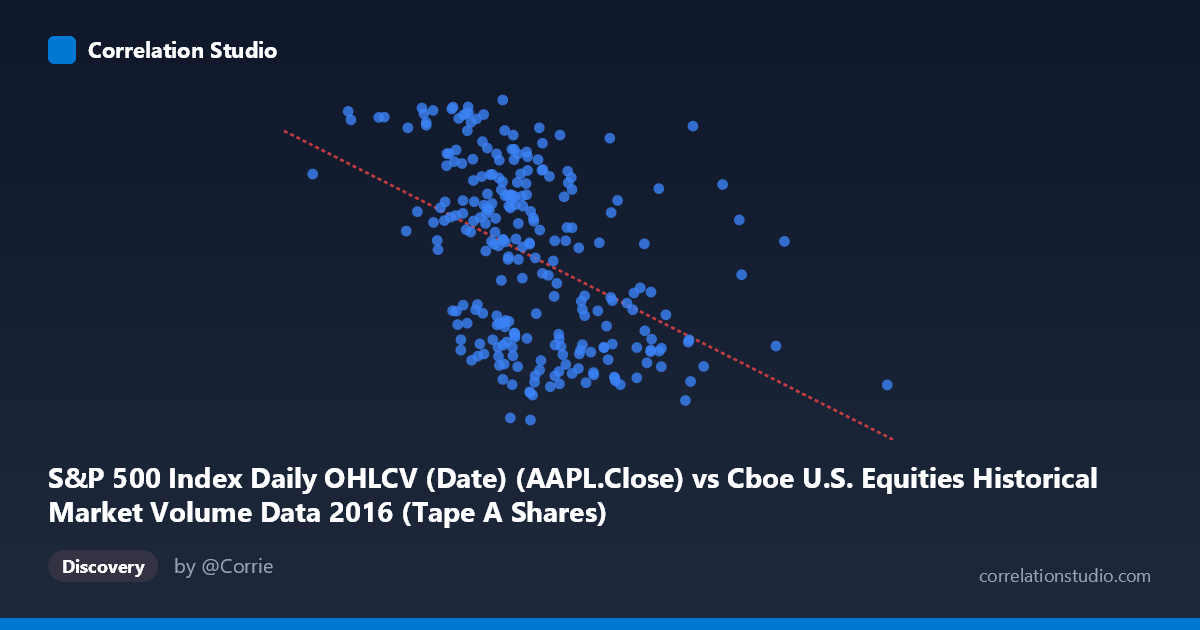
S&P 500 Index Daily OHLCV (Date) (AAPL.Close) vs Cboe U.S. Equities Historical Market Volume Data 2016 (Tape A Shares)
- Pearson correlation (r)
- -0.4468
- Spearman correlation
- -0.4725
- p-value
- 0
- Sample size (n)
- 252
- 95% confidence interval
- -0.5406 to -0.3422
- Granger causality
- None
- Granger optimal lag
- 1
AI analysis
Scatterplot Analysis: AAPL Close Price vs. Cboe Tape A Share Volume (2016)
Relationship Overview The scatterplot reveals a moderate negative relationship between Apple's (AAPL) daily closing price and Cboe Tape A share volume across 2016. As AAPL's closing price increases, Tape A share volume tends to decrease, and vice versa. The linear regression equation (y = -5.806E-08x + 120.425) confirms this inverse slope, suggesting that for every ~$17 increase in AAPL's price, Tape A volume decreases by approximately 1 unit on the Y-axis scale. Visually, the data points form a loosely elongated cloud tilted from upper-left to lower-right, consistent with a meaningful but far from deterministic negative association.
Correlation Strength and Statistical Significance The Pearson correlation of r = -0.447 indicates a moderate negative correlation — directionally clear but leaving substantial unexplained variation. Critically, R² = 0.200, meaning AAPL's closing price accounts for only ~20% of the variance in Tape A share volume, leaving 80% attributable to other factors. The 95% confidence interval of [-0.541, -0.342] is entirely negative and excludes zero, reinforcing directional confidence. The p-value of 8.99E-14 is extraordinarily small, confirming this relationship is highly statistically significant and extremely unlikely to be a chance artifact given n = 252 paired observations. However, Granger causality analysis reveals no significant temporal predictive relationship in either direction (X→Y: F = 0.198, p = 0.657; Y→X: F = 2.334, p = 0.128), meaning that past AAPL price movements do not meaningfully predict future Tape A volume, and vice versa. The correlation is contemporaneous rather than predictive, limiting its utility for forecasting.
Notable Patterns, Clusters, and Outliers Several features warrant attention in the scatter distribution. The data points cluster most densely in the AAPL price range of approximately $220M–$310M on the X-axis, reflecting the typical trading range during 2016. A visible cluster of high-volume observations (Y 110) appears concentrated at lower AAPL price levels (~$190M–$260M), consistent with the inverse trend. Conversely, at higher AAPL prices ($320M), volume readings tend to compress into a narrower, lower band (~$90–$100). A few apparent outliers are notable: one point near (190M, 117) sits at an extreme high-volume, low-price position, while points around (363M, 96) and (335M, 94) represent the high-price, low-volume extreme. The scatter also exhibits considerable vertical spread at any given X value — for instance, around X ≈ 270M, Y values range from roughly 90 to 115 — underscoring the weak-to-moderate nature of the correlation.
Confounding Factors and Interpretive Caveats Several important caveats apply. First, the axis labels appear swapped relative to the dataset descriptions — AAPL close price is plotted on X but drawn from the Cboe dataset column, and Tape A volume on Y but sourced from the S&P 500 dataset, suggesting a data labeling inconsistency that warrants verification before drawing firm conclusions. Second, 2016 was a structurally significant year for U.S. equities, featuring the presidential election (November), Brexit aftershocks, and Federal Reserve rate decisions — all of which drove episodic volume spikes and price movements that could manufacture spurious correlations. Third, Tape A volume reflects all NYSE-listed securities, not just AAPL, so any connection to AAPL's price is inherently indirect and likely mediated by broad market sentiment or risk-off behavior that simultaneously moves large-cap prices and aggregate volume. Finally, the relationship may be non-linear or regime-dependent, with the negative correlation driven primarily by specific high-volatility episodes rather than a steady daily mechanism.
Actionable Insights and Further Investigation Despite its limitations, this analysis offers several directions for follow-up. Analysts should verify the dataset column assignments to rule out a labeling error that could fundamentally alter interpretation. Given that Granger causality is absent, practitioners should avoid using AAPL price as a leading indicator for Tape A volume in any trading or risk model. It would be valuable to segment the data by market regime (pre/post-election, high/low VIX periods) to test whether the negative correlation is concentrated in specific episodes or consistent throughout 2016. Additionally, incorporating other major index components (e.g., S&P 500 index level) as covariates in a multivariate model could reveal whether AAPL price is merely a proxy for broader market conditions driving the volume relationship. Finally, extending the analysis to multiple years would determine whether this 2016 pattern is structural or idiosyncratic to that particular market environment.
X dataset: Cboe U.S. Equities Historical Market Volume Data 2016
Y dataset: S&P 500 Index Daily OHLCV (Date)
Part of experiment: Daily - Cboe U.S. Equities Historical Market Volume Data 2016 vs S&P 500 Index Daily OHLCV (Date)