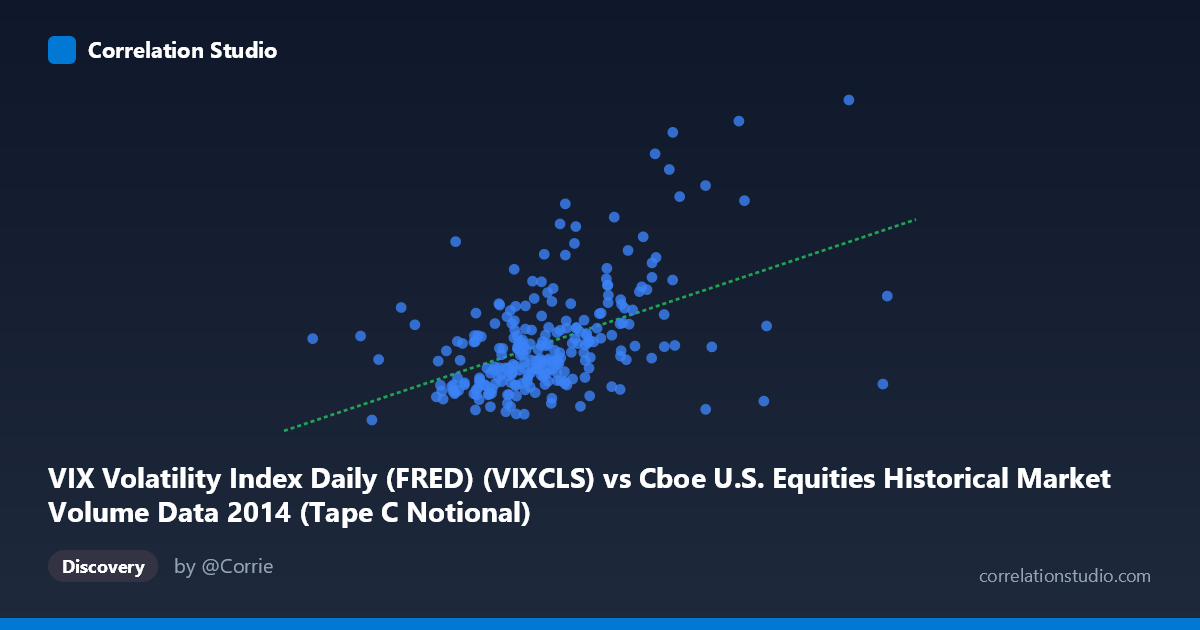
VIX Volatility Index Daily (FRED) (VIXCLS) vs Cboe U.S. Equities Historical Market Volume Data 2014 (Tape C Notional)
- Pearson correlation (r)
- 0.4843
- Spearman correlation
- 0.4665
- p-value
- 0
- Sample size (n)
- 252
- 95% confidence interval
- 0.3837 to 0.5736
- Granger causality
- None
- Granger optimal lag
- 1
AI analysis
Analysis: VIX Volatility Index vs. Cboe Tape C Notional Volume (2014)
Relationship Overview The scatterplot reveals a moderate positive relationship between the VIX Volatility Index and Cboe Tape C notional trading volume throughout 2014. As the VIX rises — indicating greater market fear and uncertainty — notional trading volume on Tape C exchanges tends to increase as well. This is broadly consistent with well-established market microstructure theory: elevated volatility typically drives higher trading activity as investors rebalance portfolios, hedge positions, and react to news flow. However, the relationship is far from clean, with considerable scatter throughout the plot suggesting that many other forces are simultaneously at work.
Correlation Strength and Statistical Framing The Pearson correlation of r = 0.4843 reflects a moderate positive association, but the explanatory power is more sobering when framed through r²: only 23.5% of the variance in Tape C notional volume is explained by VIX levels, leaving roughly three-quarters of the variation attributable to other factors. The 95% confidence interval of [0.38, 0.57] is meaningfully above zero and does not straddle zero, lending credibility to the effect's existence. The p-value of 2.22E-16 confirms the result is statistically robust against a null hypothesis of no correlation, given n = 252 paired daily observations drawn from a population of N = 3,686. Critically, however, Granger causality tests find no significant predictive directionality in either direction (X→Y: F = 0.18, p = 0.67; Y→X: F = 0.15, p = 0.70) at a one-period lag. This means that while VIX and volume co-move, knowing yesterday's VIX does not meaningfully improve forecasts of today's volume (and vice versa), suggesting the relationship is largely contemporaneous rather than leading/lagging in nature.
Notable Patterns, Clusters, and Outliers Several structural features stand out in the data. The bulk of observations cluster in the VIX range of roughly 11–17 paired with notional volumes between 11 and 17 trillion, forming a dense central cloud that anchors the regression line. However, there are notable high-leverage outliers in the upper-right quadrant — particularly a cluster of points with VIX readings above 20–25 that correspond to elevated notional volumes (e.g., the point near VIX ~25.20 at ~7.18B on X, and VIX ~23.57 at ~6.15B). These likely correspond to the October 2014 volatility spike, a well-documented market stress episode. Conversely, several high-X observations (large volume) appear with low VIX values (e.g., ~10.85 at X ≈ 6.77B), indicating episodes of high-volume trading in calm conditions — possibly index rebalancing, options expiration, or end-of-quarter flows — which dilute the correlation and introduce non-linearity. The relationship may be better described as threshold-driven rather than linear: volume appears to surge sharply only when VIX breaches elevated levels.
Confounding Factors and Caveats Several important caveats temper straightforward interpretation. First, Tape C notional value is heavily influenced by stock price levels — higher-priced stocks mechanically inflate notional figures regardless of volume count, meaning price-level drift during 2014 could confound the relationship. Second, calendar effects such as options expiration Fridays, end-of-quarter rebalancing, and index reconstitution days generate volume spikes independent of volatility. Third, the single-year scope (2014) limits generalizability — this was a period of broadly low but episodically spiking volatility, and the correlation structure could look quite different across different volatility regimes (e.g., 2008 or 2020). Fourth, the absence of Granger causality at lag-1 may simply reflect that the relevant lag structure is intraday or contemporaneous, which daily data cannot capture. Fifth, both series may be jointly driven by common macro shocks (e.g., geopolitical events, Fed announcements) rather than one influencing the other.
Actionable Insights and Further Investigation Practitioners and researchers should consider several follow-up analyses. First, testing non-linear (e.g., piecewise or polynomial) models would help determine whether the VIX–volume relationship only activates above a threshold (e.g., VIX 18–20), which would have direct implications for trading strategy and risk management. Second, decomposing Tape C notional into share volume and price-level components would isolate whether activity or valuation is driving the signal. Third, extending the analysis across multiple years — particularly including 2008, 2018, and 2020 — would test whether this r ≈ 0.48 relationship is regime-stable or whether it strengthens dramatically during true crisis periods. Fourth, exploring intraday lags via higher-frequency data could reveal the contemporaneous co-movement the Granger tests hint at. Finally, incorporating additional explanatory variables (e.g., S&P 500 returns, Federal Reserve meeting dates, options expiration flags) into a multivariate framework would likely substantially improve on the 23.5% explained variance this bivariate model achieves.
X dataset: Cboe U.S. Equities Historical Market Volume Data 2014
Y dataset: VIX Volatility Index Daily (FRED)
Part of experiment: Daily - Cboe U.S. Equities Historical Market Volume Data 2014 vs VIX Volatility Index Daily (FRED)