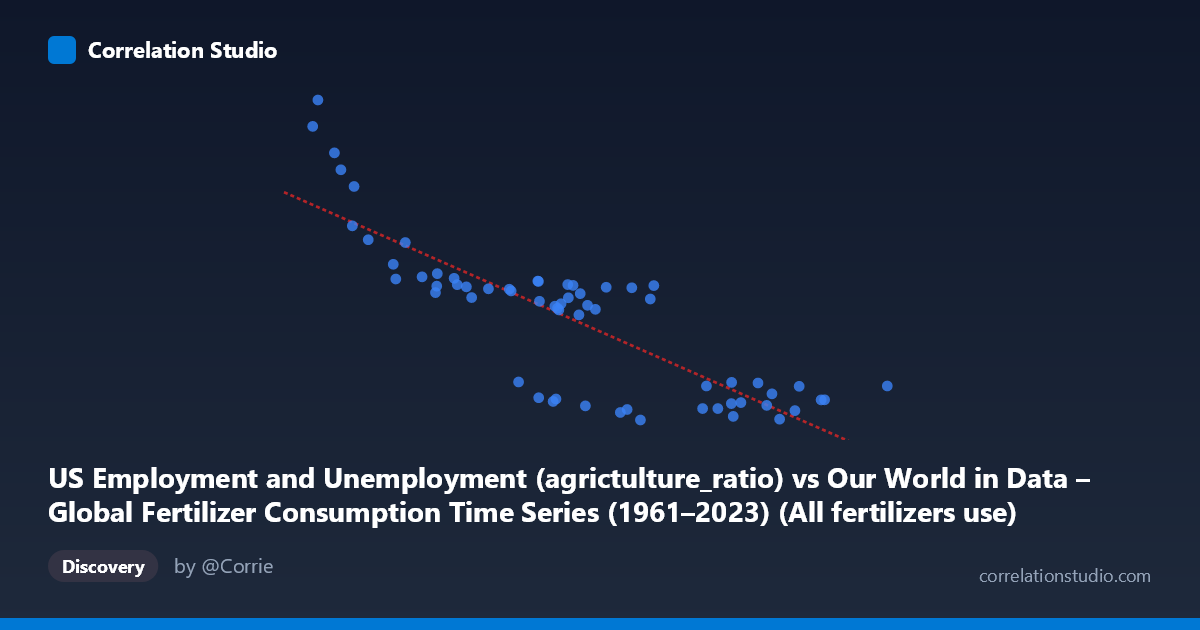
US Employment and Unemployment (agrictulture_ratio) vs Our World in Data – Global Fertilizer Consumption Time Series (1961–2023) (All fertilizers use)
- Pearson correlation (r)
- -0.8289
- Spearman correlation
- -0.8122
- p-value
- 0
- Sample size (n)
- 63
- 95% confidence interval
- -0.8932 to -0.7313
- Granger causality
- None
- Granger optimal lag
- 10
AI analysis
Analysis of US Agriculture Employment Ratio vs. Global Fertilizer Consumption
1. Overall Relationship The scatterplot reveals a clear negative relationship between the US agriculture employment ratio (X-axis) and global all-fertilizer use (Y-axis). As the agriculture employment ratio increases — representing earlier decades when a larger share of the US workforce was in agriculture — global fertilizer consumption was substantially higher. Conversely, as the agricultural employment ratio has declined over time (reflecting modernization and labor substitution), fertilizer use has fallen. The linear regression equation (y = −0.000125x + 4,578.76) captures this descending trend, though the relationship contains notable scatter, suggesting the association is real but not perfectly deterministic.
2. Correlation Strength and Statistical Interpretation The correlation of r = −0.8289 indicates a strong negative association, with r² = 0.6871 meaning that approximately 68.7% of the variance in fertilizer consumption is statistically explained by variation in the agriculture employment ratio. This is a meaningfully large proportion. The 95% confidence interval [−0.8932, −0.7313] is relatively narrow and entirely negative, confirming robust directional certainty — this is not a borderline result. The p-value of ~0 confirms the relationship is highly unlikely to be due to chance. However, the Granger causality results complicate the narrative considerably: neither direction (X→Y nor Y→X) achieves statistical significance at conventional thresholds (F = 1.22, p = 0.31 for X→Y; F = 1.35, p = 0.25 for Y→X), even at the optimal lag of 10 periods. This means that despite the strong contemporaneous correlation, neither variable reliably predicts the other temporally, which is a critical caveat against causal interpretation.
3. Notable Patterns, Clusters, and Outliers The data visibly separates into at least two behavioral clusters. A dense cluster occupies the mid-to-high X range (roughly 9M–14M employment ratio) with fertilizer values tightly grouped between ~2,200 and ~3,500 — suggesting a period of relative stability in both variables. A second, more dispersed cluster appears at lower X values (3M–7M), where fertilizer consumption is markedly higher (3,300–5,200), with several prominent outliers: the points near (3,333,884; 5,200) and (3,156,855; 4,944) stand out as high-leverage observations corresponding to earlier time periods. The relationship also appears to exhibit mild non-linearity — the decline in fertilizer use may plateau at higher employment ratio values, suggesting a possible logarithmic or threshold structure that a simple linear model may underfit.
4. Confounding Factors and Caveats This correlation is almost certainly driven by shared time trends rather than a direct mechanistic relationship. Both variables are time-indexed from 1961 to 2023, and most of their covariance likely reflects the passage of time itself: agricultural employment ratios declined as economies modernized, and global fertilizer consumption patterns shifted due to geopolitical events (e.g., the 1970s energy crises affecting nitrogen fertilizer costs), Green Revolution diffusion, and changing global agricultural demand. The US employment ratio is a domestic metric, while global fertilizer use is an aggregate of worldwide agricultural behavior — these are conceptually distinct systems unlikely to causally interact. The failure of Granger causality tests reinforces this. Additionally, with n = 63 observations drawn from an N = 86 population, some selection effects may exist, and the optimal lag of 10 periods (~10 years) without reaching significance suggests any lagged dynamics are weak.
5. Actionable Insights and Further Investigation Rather than treating this as a predictive relationship, the most productive next step would be to partial out the time trend using detrending or first-differencing both series, then re-examine the residual correlation to determine whether any genuine structural link remains. Researchers should also consider multivariate models incorporating confounders such as global population, energy prices, and regional agricultural policy. Exploring whether a non-linear functional form (logarithmic or piecewise) improves fit over the linear model would also be valuable given the visible clustering. Finally, decomposing global fertilizer use by region and testing against region-specific employment metrics could reveal whether this correlation is entirely an artifact of shared historical timing or reflects some genuine economic substitution dynamic between labor and agrochemical inputs.
X dataset: Our World in Data – Global Fertilizer Consumption Time Series (1961–2023)
Y dataset: US Employment and Unemployment
Part of experiment: Yearly - Our World in Data – Global Fertilizer Consumption Time Series (1961–2023) vs US Employment and Unemployment