VIX Volatility Index Daily (FRED) (VIXCLS) vs Cboe U.S. Equities Historical Market Volume Data 2009 (Total Trade Count)
- Pearson correlation (r)
- 0.7698
- Spearman correlation
- 0.8005
- p-value
- 0
- Sample size (n)
- 252
- 95% confidence interval
- 0.7141 to 0.8158
- Granger causality
- None
- Granger optimal lag
- 1
AI analysis
VIX Volatility Index vs. U.S. Equity Market Trade Count (2009)
Relationship Overview
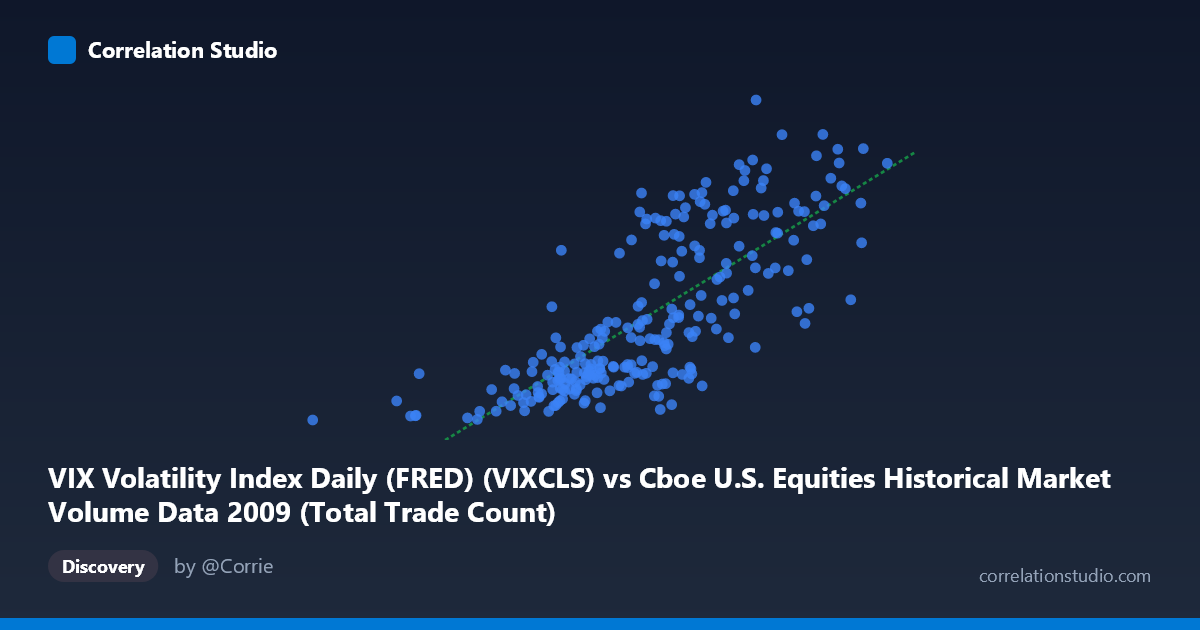
The scatterplot reveals a moderately strong positive relationship between the VIX Volatility Index and total trade count in U.S. equity markets throughout 2009. As VIX values rise — indicating greater implied volatility and market fear — trading activity measured by total trade count also increases substantially. This is intuitively consistent with market microstructure theory: periods of heightened uncertainty drive investors and traders to rebalance portfolios, hedge positions, and react to news, all of which generate elevated transaction volumes. The linear regression equation (y = 1.1668E-05x + 0.360132) suggests that for every unit increase in trade count (X), VIX rises by approximately 0.0000117 points, though the practical interpretation runs more naturally in the reverse descriptive direction.
Correlation Strength and Statistical Significance
The Pearson correlation of r = 0.770 represents a meaningfully strong positive association, and the R² of 0.593 indicates that approximately 59.3% of the variance in VIX is explained by trade count, leaving roughly 40% attributable to other factors. The 95% confidence interval of [0.714, 0.816] is relatively narrow given the sample size of n = 252, and the p-value of effectively zero confirms this is not a chance finding across the N = 3,232 population. However, the Granger causality results tell a critically important story: neither direction (X→Y: F = 0.290, p = 0.591; Y→X: F = 0.066, p = 0.797) reaches statistical significance at even a lenient threshold. This means that neither variable reliably predicts the other one period ahead — the correlation is concurrent rather than temporally predictive, which substantially limits any causal interpretation.
Notable Patterns and Outliers
The scatterplot exhibits several important structural features. There appears to be a loose but visible positive trend with considerable scatter, particularly at higher trade count values (X 3,000,000) where VIX readings span a wide range from roughly 25 to 56. A cluster of points in the lower-left region (X: 629K–2,200K; Y: ~19–26) likely corresponds to calmer mid-to-late 2009 market conditions as volatility normalized post-financial crisis. The point at approximately (629,671, 19.47) stands out as a potential outlier representing unusually low volume paired with minimal volatility. Conversely, several high-trade-count, high-VIX observations in the upper right (e.g., ~3,841K at VIX 49.33; ~3,741K at VIX 52.65) likely correspond to early 2009 when crisis-era fear was still elevated. The relationship also shows possible heteroscedasticity — variance in VIX appears to widen as trade count increases, suggesting the linear model may not fully capture the dynamics at extremes.
Confounding Factors and Caveats
Several important caveats apply. First, 2009 is a highly unusual year — it spans the tail of the 2008-09 financial crisis, a market bottom in March, and a dramatic recovery rally, meaning both variables were simultaneously driven by a third factor: the macroeconomic crisis cycle itself. This is a classic spurious correlation through common cause scenario, where VIX and trade volume both respond to news flow and systemic risk rather than causing one another. Second, intraday and structural market changes (e.g., high-frequency trading expansion, exchange fragmentation) could independently inflate trade counts in ways unrelated to fear. Third, the dataset covers only one calendar year, making it impossible to distinguish whether this relationship is stable or unique to crisis/recovery dynamics. Finally, the axis labels appear to be swapped in the dataset description (VIX as X, trade count as Y), which warrants verification before publishing findings.
Actionable Insights and Further Investigation
Despite the absence of Granger causality, the contemporaneous correlation is strong enough to be practically useful for real-time risk monitoring — elevated trade counts on a given day are associated with higher VIX regimes and should trigger enhanced liquidity and margin risk assessments. For deeper investigation, analysts should: (1) extend the time series across multiple years (2005–2023) to test whether the r ≈ 0.77 relationship holds outside crisis periods; (2) decompose trade count by exchange type (lit vs. dark pools, TRFs) to identify which venue's activity drives the correlation; (3) apply non-linear regression or quantile regression to better model the apparent variance expansion at high trade volumes; and (4) introduce lagged macro variables (S&P 500 returns, credit spreads, Fed announcements) as controls to isolate the partial correlation between VIX and trade count net of confounders.
X dataset: Cboe U.S. Equities Historical Market Volume Data 2009
Y dataset: VIX Volatility Index Daily (FRED)
Part of experiment: Daily - Cboe U.S. Equities Historical Market Volume Data 2009 vs VIX Volatility Index Daily (FRED)