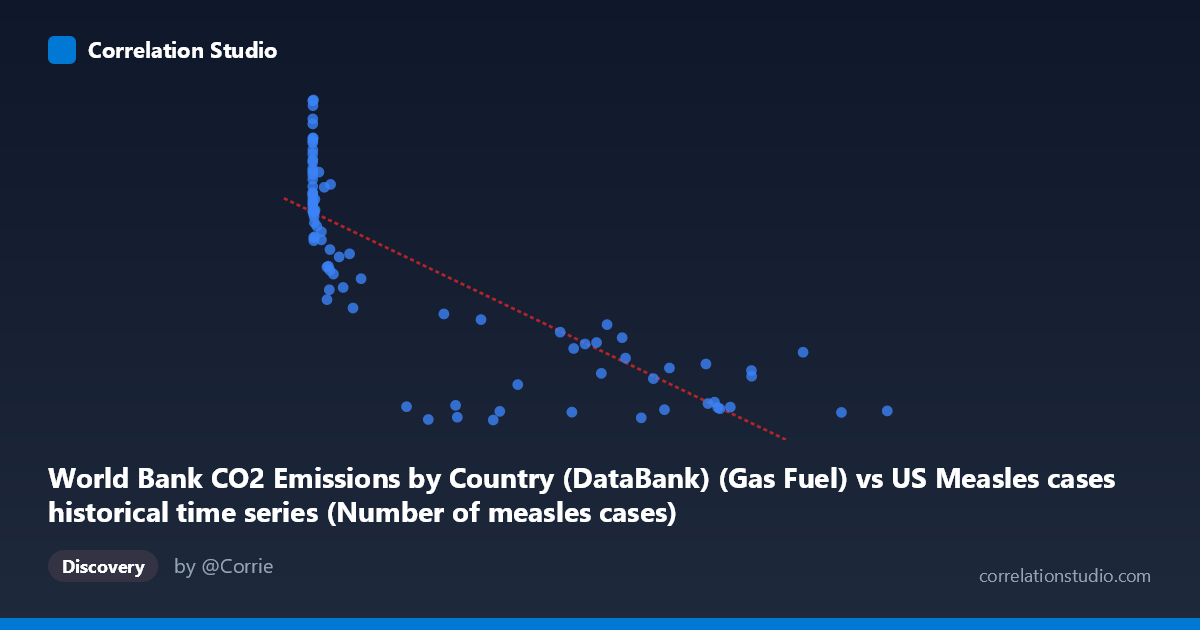
World Bank CO2 Emissions by Country (DataBank) (Gas Fuel) vs US Measles cases historical time series (Number of measles cases)
- Pearson correlation (r)
- -0.8098
- Spearman correlation
- -0.8872
- p-value
- 0
- Sample size (n)
- 87
- 95% confidence interval
- -0.8718 to -0.7224
- Granger causality
- None
- Granger optimal lag
- 10
AI analysis
Scatterplot Analysis: US Measles Cases vs. Gas Fuel CO2 Emissions
Overall Relationship Pattern
The scatterplot reveals a striking negative relationship between gas fuel CO2 emissions and US measles case counts across the 1919–2020 timeframe. As emissions rise (moving right along the X-axis), measles cases fall sharply — from values exceeding 16,000 cases at very low emission levels (X < 1,000) down to near-zero or sub-1,000 cases at high emission levels (X 500,000). The relationship is visually dominated by a steep decline at low X values that progressively flattens, suggesting a hyperbolic or power-law curve rather than a truly linear one, even though a linear regression has been fitted. The data points cluster heavily in two broad regions: a dense low-emission/high-measles zone on the left, and a sprawling high-emission/low-measles zone on the right.
Correlation Strength and Statistical Interpretation
The Pearson correlation of r = -0.81 indicates a strong negative association, and R² = 0.656 means that approximately 65.6% of the variance in measles cases is statistically explained by gas fuel emissions within this linear model. The 95% confidence interval of [-0.87, -0.72] is notably tight and lies entirely in negative territory, and the p-value of ~0 confirms the result is highly unlikely to be due to chance. However, these statistics must be interpreted carefully: the linear model is likely misspecified given the evident non-linearity, meaning R² probably understates the explanatory power of a better-fitting curve while also overstating the reliability of linear extrapolation. The Granger causality tests show no significant predictive direction in either direction (X→Y: F = 0.42, p = 0.93; Y→X: F = 0.58, p = 0.82), which is a critical finding — even though the correlation is strong, neither variable temporally predicts the other after accounting for lags up to 10 periods, strongly arguing against any direct causal mechanism.
Notable Patterns, Clusters, and Outliers
Several features stand out. First, there is a tight high-leverage cluster at very low X values (X < 5,000) where measles cases range wildly from ~9,500 to ~16,992, suggesting high variability in early decades before any systematic intervention. Second, a group of extreme low-measles, high-emission outliers — such as (894134, 654), (822811, 575), and (763094, 3737) — anchor the right tail and exert substantial influence on the regression slope. Third, the point (280930, 176.83) is a notable low-Y outlier that may represent an anomalous year (possibly post-vaccine era with an unusually low case count). Fourth, the point (1274, 16992) is the highest measles observation and sits at very low emissions, consistent with pre-vaccine era data. The overall shape — steep initial drop followed by a long flat tail — is characteristic of a reciprocal or logarithmic decay function.
Confounding Factors and Causal Caveats
This correlation is a textbook example of a spurious temporal correlation driven by a shared historical trend. Both variables are time-indexed from 1919 to 2020: measles cases declined dramatically following the introduction of the measles vaccine in 1963, while gas fuel CO2 emissions rose monotonically throughout the 20th century due to industrialization and energy consumption growth. These two trends are both products of post-WWII modernization, not causally linked to each other. Additional confounders include population growth, public health infrastructure improvements, herd immunity dynamics, changing reporting standards, and Cold War-era economic expansion — all of which correlate with both time series simultaneously. The Granger causality null result reinforces this: emissions have zero temporal predictive power over measles outbreaks, which are governed by vaccination coverage, population density, and viral transmission dynamics entirely unrelated to fossil fuel use.
Actionable Insights and Further Investigation
Despite being non-causal, this analysis has methodological value. Researchers should refit the model using a logarithmic or power transformation of X (log-emissions vs. measles cases), which would likely yield a more linear relationship and a better-calibrated R². More meaningfully, a multivariate model incorporating year, vaccination coverage rates, and population size would disentangle the time-trend confound and reveal whether any residual association exists after controlling for the vaccine introduction discontinuity around 1963. It would be particularly valuable to split the time series at 1963 and examine whether the pre- and post-vaccine periods show distinct structural relationships. Finally, this dataset pair serves as a useful pedagogical case study for spurious correlation detection: a high R² and low p-value in a bivariate model are insufficient evidence of a meaningful relationship when both variables share a common temporal driver.
X dataset: US Measles cases historical time series
Y dataset: World Bank CO2 Emissions by Country (DataBank)
Part of experiment: Yearly - US Measles cases historical time series vs World Bank CO2 Emissions by Country (DataBank)