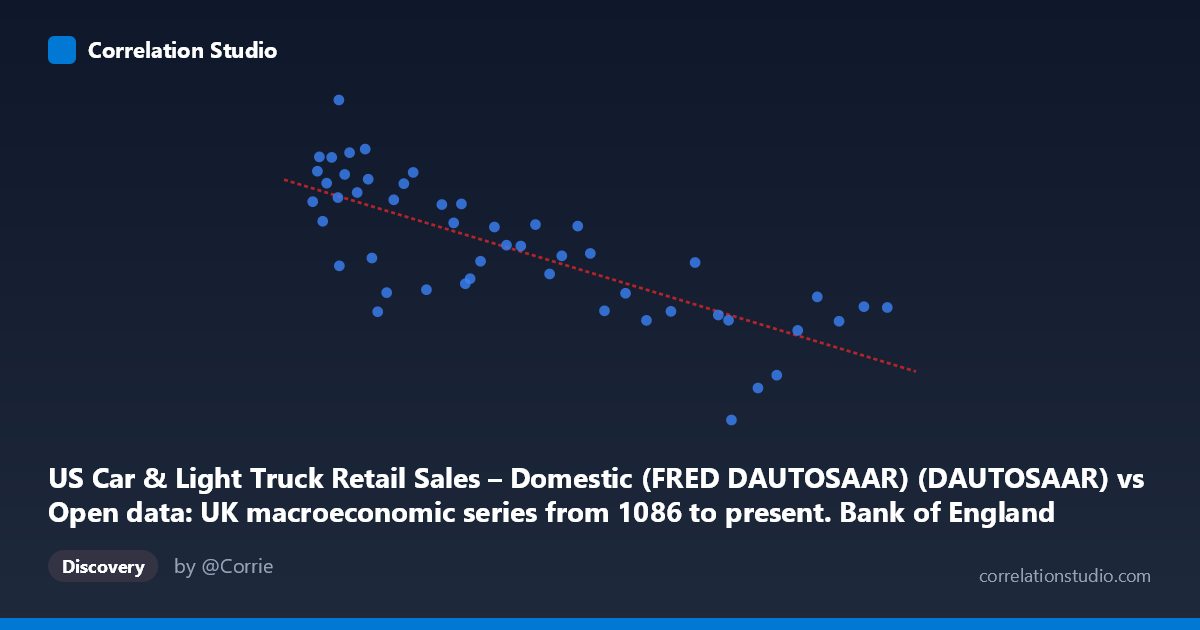
US Car & Light Truck Retail Sales – Domestic (FRED DAUTOSAAR) (DAUTOSAAR) vs Open data: UK macroeconomic series from 1086 to present. Bank of England Millennium of Macroeconomic Data. (Year) (value)
- Pearson correlation (r)
- -0.7714
- Spearman correlation
- -0.8022
- p-value
- 0
- Sample size (n)
- 50
- 95% confidence interval
- -0.8642 to -0.6278
- Granger causality
- None
- Granger optimal lag
- 1
AI analysis
Scatterplot Analysis: US Domestic Auto Sales vs. UK Macroeconomic Indicator
Relationship Overview
The scatterplot reveals a clear negative relationship between US domestic car and light truck retail sales (X-axis) and the UK macroeconomic variable from the Bank of England dataset (Y-axis). As US auto sales volume increases, the UK indicator value tends to decline systematically. The linear regression equation (y = −9.70×10⁻⁶x + 8.738) confirms this inverse trajectory, with the slope indicating that each additional ~103,000 units in annual auto sales corresponds to roughly a one-unit decrease in the UK variable. The data spans 1967–2016, meaning this relationship unfolds across five decades of economic cycles, recessions, and structural shifts in both the US auto industry and the UK economy.
Correlation Strength and Statistical Significance
The correlation of r = −0.7714 represents a strong negative association, and the r² value of 0.5950 means that approximately 59.5% of the variance in the UK indicator is statistically explained by variation in US auto sales — a substantial explanatory share for cross-national economic data. The 95% confidence interval of [−0.8642, −0.6278] is relatively tight and entirely negative, reinforcing that the inverse direction of association is robust and not a sampling artifact. The p-value of 5.55×10⁻¹¹ is extraordinarily small, making it statistically implausible that this correlation arose by chance. However, the Granger causality tests complicate the picture significantly: neither direction (X→Y nor Y→X) approaches significance at lag 1 (F = 0.956, p = 0.333 and F = 0.518, p = 0.475, respectively). This means that despite the strong contemporaneous correlation, past values of US auto sales do not reliably predict future values of the UK indicator, and vice versa — suggesting the relationship is associative and likely driven by shared underlying forces rather than direct causal transmission.
Notable Patterns, Clusters, and Outliers
The data exhibits a fairly coherent linear band across the mid-range of X values (~100,000–300,000 units), where the negative trend is most consistent. At lower sales volumes (X < 120,000), Y values cluster predominantly between 7.5 and 10.1, suggesting periods of low US auto demand coincide with elevated UK indicator readings — likely corresponding to recessions such as the early 1970s oil shock or 2008–2009 financial crisis. Several notable outliers demand attention: the point at approximately (377,212, 3.62) and (358,429, 2.90) sit well below the regression line, representing unusually low UK values even among high auto-sales observations, potentially reflecting idiosyncratic UK economic distress. Conversely, (80,459, 10.14) and (88,022, 8.95) represent the upper-left cluster where both low US sales and high UK values coincide. The spread increases somewhat at moderate X values, hinting at possible heteroscedasticity or regime-dependent behavior.
Confounding Factors and Interpretive Caveats
The most important caveat is that correlation across two entirely different national datasets does not imply any direct economic mechanism. Both series are almost certainly responding independently to global macroeconomic cycles — recessions depress US auto demand while simultaneously affecting UK economic conditions, creating a spurious-looking but structurally driven co-movement. The Y-axis variable is not precisely identified beyond being a Bank of England millennium dataset value, which could represent anything from interest rates to wages to equity prices, making economic interpretation speculative. Additionally, the 50-year time span introduces substantial structural breaks (oil shocks, deindustrialization, financialization, globalization) that may create non-stationary relationships, inflating apparent correlation. The annual aggregation of what is described as a monthly SAAR series for X also introduces temporal averaging that can artificially smooth and strengthen correlations. The absence of Granger causality despite high contemporaneous r² is itself a strong signal that a latent common driver — most plausibly global business cycles or synchronized monetary policy regimes — explains most of the observed association.
Actionable Insights and Further Investigation
To meaningfully interpret this relationship, the identity and units of the UK Y-axis variable must be clarified — the analysis is fundamentally limited without knowing whether it represents interest rates, inflation, GDP growth, or another measure. Researchers should consider applying cointegration testing (e.g., Engle-Granger or Johansen) to assess whether these series share a long-run equilibrium, which would be more appropriate than Granger causality for annual data over 50 years. Controlling for a global economic cycle proxy (e.g., world GDP growth or oil prices) in a multivariate regression would reveal how much of the observed r = −0.77 survives once shared cyclical exposure is removed. It would also be valuable to test for structural breaks around 1979, 1990, and 2008 to determine whether the correlation is stable or regime-dependent. Finally, extending the lag structure in Granger tests beyond 1 period may reveal delayed predictive relationships that the current optimal-lag-1 framework misses.
X dataset: Open data: UK macroeconomic series from 1086 to present. Bank of England Millennium of Macroeconomic Data. (Year)
Y dataset: US Car & Light Truck Retail Sales – Domestic (FRED DAUTOSAAR)
Part of experiment: Yearly - Open data: UK macroeconomic series from 1086 to present. Bank of England Millennium of Macroeconomic Data. (Year) vs US Car & Light Truck Retail Sales – Domestic (FRED DAUTOSAAR)