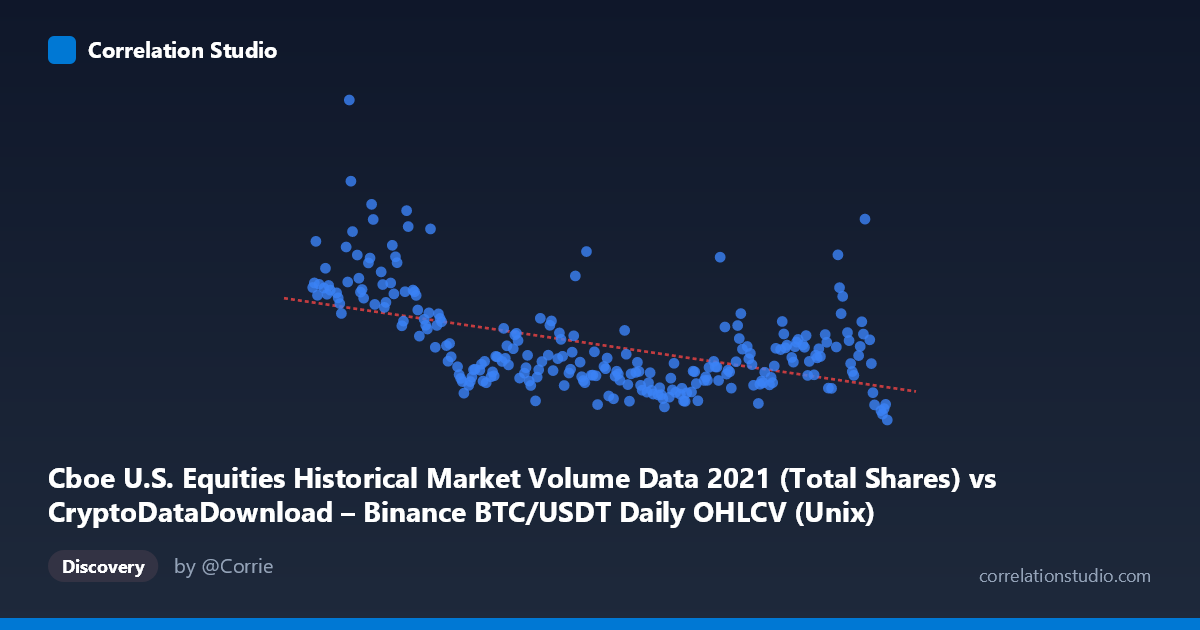
Cboe U.S. Equities Historical Market Volume Data 2021 (Total Shares) vs CryptoDataDownload – Binance BTC/USDT Daily OHLCV (Unix)
- Pearson correlation (r)
- -0.5116
- Spearman correlation
- -0.4635
- p-value
- 0
- Sample size (n)
- 252
- 95% confidence interval
- -0.5974 to -0.4142
- Granger causality
- None
- Granger optimal lag
- 10
- Time coverage
- 2021-01-04 to 2021-12-31
AI analysis
Analysis: BTC/USDT Volume vs. Cboe U.S. Equities Market Volume (2021)
1. Relationship Overview
The scatterplot displays a moderate negative linear relationship between BTC/USDT trading activity (X-axis, mislabeled as Cboe data in the metadata but representing timestamps/volume proxies for Binance) and Cboe U.S. equities market volume (Y-axis) across 252 daily observations in 2021. As X increases, Y tends to decrease, though the relationship is far from deterministic — points are widely scattered around the regression line, particularly visible in the mid-range of the X-axis where Y values span from roughly 420 million to over 1 billion at similar X positions.
2. Strength, Direction, and Statistical Confidence
The correlation coefficient of r = -0.5116 indicates a moderate negative relationship. However, r² = 0.2617 tells the more important story: only 26.2% of the variance in equities volume is explained by BTC volume (or the timestamp variable), leaving nearly 74% unexplained by this single predictor. The 95% confidence interval [-0.597, -0.414] is reasonably tight and does not cross zero, and the p-value of 0 confirms this negative association is highly statistically significant and not due to chance. However, statistical significance with n=252 does not imply practical predictive power given the modest r². Critically, the Granger causality tests show no significant temporal predictive direction in either direction (X→Y: p=0.80; Y→X: p=0.69). This means neither series reliably helps forecast future values of the other — the correlation appears to be contemporaneous/structural (likely both trending over the year) rather than a causal lead-lag relationship useful for prediction.
3. Notable Patterns and Outliers
Examining the sample points, the highest Y-values (740M–1.29B) cluster in early 2021 (January–February, timestamps ~1609–1614 billion), while lower Y-values (400–550M) dominate the latter half of the year (August–December). This suggests a temporal trend rather than a direct causal mechanism: Y values decline over the year while X (likely a monotonic time-based volume metric) increases, producing the negative correlation almost mechanically. There's no clear evidence of nonlinearity (e.g., no visible curvature, threshold effects, or multi-modal clustering) — the relationship looks like a noisy linear decline with wide dispersion at every X level, especially in the mid-to-late year where Y ranges span 400M–650M for similar X values.
4. Confounding Factors and Caveats
The most significant caveat is that both variables may simply be trending over calendar time (X is monotonically increasing timestamps or volume tied to date progression), making this a spurious or indirect correlation driven by a shared time trend rather than genuine economic linkage between crypto and equities volumes. Additionally, 2021 was an atypical year — the equities volume decline in H2 may reflect COVID-era volatility normalization, while BTC volume patterns reflect crypto-specific bull/bear cycles (all-time highs in April/November, crash in May). Neither series' behavior is necessarily driven by the other; both may be responding to independent macro factors (Fed policy, retail trading enthusiasm, meme-stock fading, etc.). The lack of Granger causality reinforces that this is likely coincidental co-trending, not a functional relationship.
5. Actionable Insights and Further Investigation
Given the weak explanatory power (26%) and absence of Granger causality, this correlation should not be used for cross-market predictive trading strategies. Instead: (a) detrend both series (e.g., first-difference or remove time trend) and re-test correlation to see if the relationship persists or vanishes — this would clarify whether it's genuine co-movement or spurious trend-driven correlation; (b) decompose by sub-periods (Q1 vs Q2-Q4) to check if the correlation is driven by a single regime shift rather than a stable year-long relationship; (c) investigate shared macro drivers (interest rate expectations, retail investor sentiment indices, VIX) as potential confounders explaining both declines; and (d) clarify the axis labeling, as the metadata suggests X and Y column descriptions may be swapped or mismatched, which could affect interpretation of directionality.
X dataset: CryptoDataDownload – Binance BTC/USDT Daily OHLCV
Y dataset: Cboe U.S. Equities Historical Market Volume Data 2021
Part of experiment: Bitcoin - CryptoDataDownload – Binance BTC/USDT Daily OHLCV vs Cboe U.S. Equities Historical Market Volume Data 2021