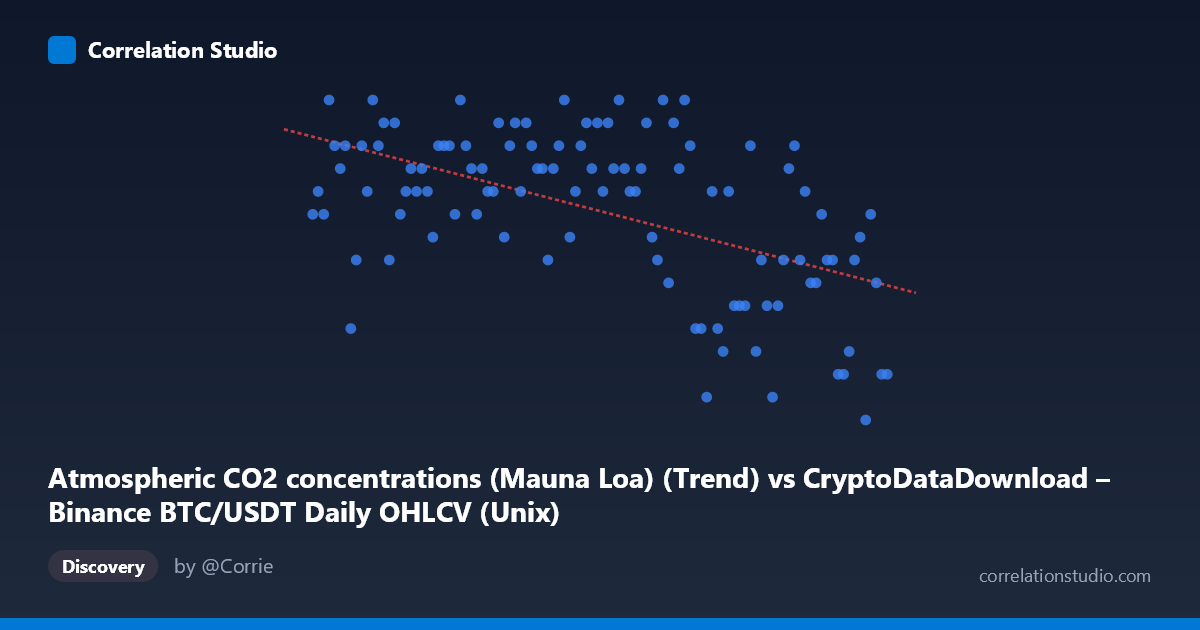
Atmospheric CO2 concentrations (Mauna Loa) (Trend) vs CryptoDataDownload – Binance BTC/USDT Daily OHLCV (Unix)
- Pearson correlation (r)
- -0.5081
- Spearman correlation
- -0.4483
- p-value
- 0
- Sample size (n)
- 102
- 95% confidence interval
- -0.6394 to -0.348
- Granger causality
- None
- Granger optimal lag
- 1
AI analysis
Correlation Analysis: Atmospheric CO2 vs. BTC/USDT Trading Data
1. Overview of the Relationship
This scatterplot presents a statistically unusual pairing: atmospheric CO2 concentration trends from Mauna Loa Observatory against Bitcoin trading timestamps. The visualization shows a moderate negative linear trend, with the regression line sloping downward (y = -2.246E-11x + 63.08). Points cluster fairly tightly in the upper-middle range (Y values 24-31) for earlier X values, then show a distinct downward shift and increased spread toward the later time period, roughly corresponding to 2024-2026.
2. Strength, Direction, and Statistical Uncertainty
The correlation coefficient (r = -0.508) indicates a moderate negative relationship, with r² = 0.258 meaning only about 26% of the variance in one variable is explained by the other — leaving roughly 74% unexplained by this simple linear model. The 95% confidence interval [-0.639, -0.348] is reasonably tight and excludes zero, and the p-value (4.996E-08) confirms this correlation is highly unlikely to be due to random chance in this sample. However, statistical significance here reflects the structure of the data (time-ordering) rather than a genuine causal or mechanistic link. Critically, the Granger causality tests show no significant predictive direction in either direction (X→Y: p=0.753; Y→X: p=0.420), indicating that neither series meaningfully forecasts the other over time — this is a strong signal against any real dynamic relationship.
3. Notable Patterns and Outliers
The most visually striking feature is a regime shift: values remain elevated (25-31) through most of the timeline, then drop sharply to 18-22 in the final segment (points after ~1725000000000, corresponding to late 2024/2025). This creates the appearance of a negative trend but looks more like a step change than a smooth linear decline — suggesting the correlation is driven by this late-period cluster rather than a consistent relationship throughout. No clear cyclical or seasonal pattern is evident despite CO2's well-known seasonal cycle, likely because the "trend" (deseasonalized) column was used.
4. Confounding Factors and Caveats
This pairing is a textbook case of spurious correlation. Atmospheric CO2 rises steadily and monotonically due to well-documented physical processes, while BTC/USDT timestamps are simply a sequential index of trading days — these two variables have no plausible causal mechanism connecting them. Any correlation here almost certainly reflects shared trends with time (both series evolve over the same calendar period) rather than genuine interaction. The apparent "relationship" is a mathematical artifact of regressing two time-indexed series against each other, sometimes called a "nonsense regression" in econometrics.
5. Recommendations
This result should not be interpreted as evidence of any real-world relationship between CO2 and Bitcoin metrics. The lack of Granger causality in either direction reinforces this. Analysts should: (1) avoid using this pairing for any predictive or explanatory modeling; (2) if investigating genuine climate-crypto links (e.g., mining energy consumption vs. emissions) use properly aligned, causally-motivated variables rather than arbitrary timestamp fields; (3) apply differencing or detrending to both series before correlating time-based data to avoid spurious trend-driven correlations; and (4) treat this as a cautionary example of why r² and p-values alone cannot establish meaningful relationships without domain-grounded causal reasoning.
X dataset: CryptoDataDownload – Binance BTC/USDT Daily OHLCV
Y dataset: Atmospheric CO2 concentrations (Mauna Loa)
Part of experiment: Bitcoin - CryptoDataDownload – Binance BTC/USDT Daily OHLCV vs Atmospheric CO2 concentrations (Mauna Loa)