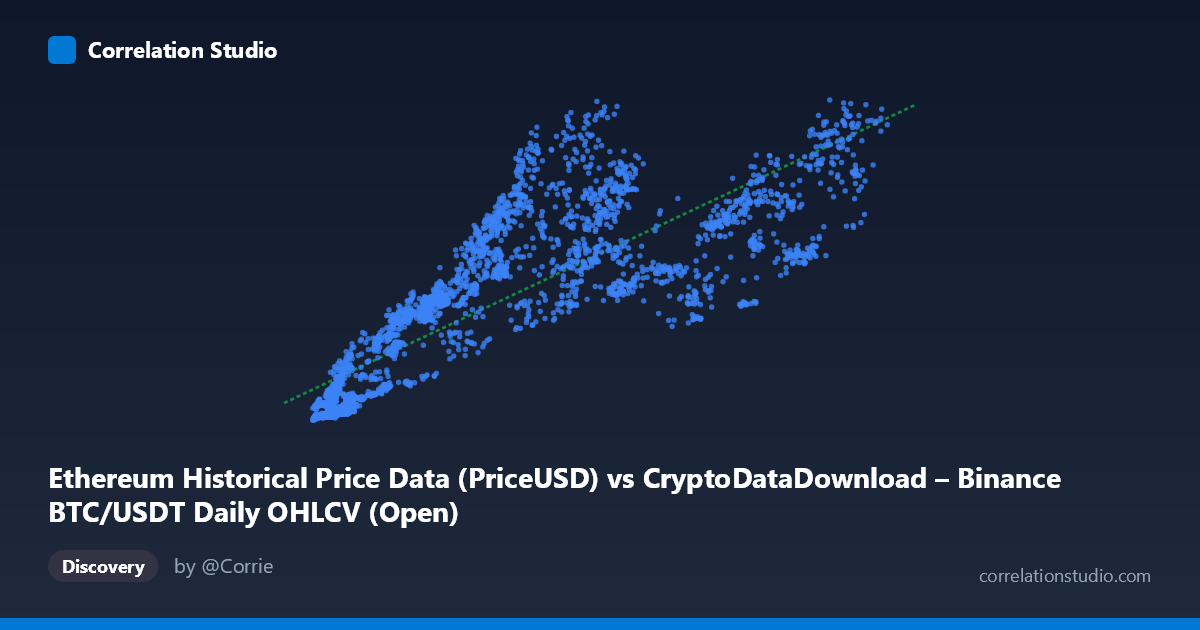
Ethereum Historical Price Data (PriceUSD) vs CryptoDataDownload – Binance BTC/USDT Daily OHLCV (Open)
- Pearson correlation (r)
- 0.8401
- Spearman correlation
- 0.908
- p-value
- 0
- Sample size (n)
- 3191
- 95% confidence interval
- 0.8296 to 0.8501
- Granger causality
- None
- Granger optimal lag
- 4
- Time coverage
- 2017-08-17 to 2026-05-20
AI analysis
Analysis: BTC/USDT Price vs. Ethereum Price Relationship
Note on labeling: The axis metadata appears swapped/mislabeled — X is described as Ethereum price while the dataset name references BTC/USDT, and Y is described as BTC/USDT Open while its dataset name references Ethereum. Given the value ranges (X: $3,188–$124,658 aligns with BTC; Y: $82.83–$4,831 aligns with ETH), this analysis treats X = BTC price and Y = ETH price, which is the more plausible interpretation given known historical price ranges for both assets.
1. Relationship Overview The scatterplot shows a clear positive, roughly linear relationship between BTC and ETH prices across the 2017–2026 period. As BTC price rises, ETH price tends to rise proportionally, consistent with the well-known tendency of major cryptocurrencies to move together due to shared market sentiment, liquidity flows, and macro drivers.
2. Strength, Direction, and Predictive Power The correlation (r = 0.840) is strong and positive, with r² = 0.706 indicating that ~70.6% of the variance in ETH price can be statistically explained by BTC price — a substantial share, though nearly 30% of ETH's movement is driven by factors independent of BTC (e.g., ETH-specific news, DeFi/NFT cycles, network upgrades). The 95% CI [0.830, 0.850] is tight given the large sample (n=3,191), and p≈0 confirms this relationship is not due to chance. However, the Granger causality tests show no significant predictive direction in either direction (BTC→ETH: p=0.366; ETH→BTC: p=0.547). This is an important nuance: while the two prices are strongly correlated contemporaneously, neither asset's past values help forecast the other's future values at the tested lag (4 periods). This suggests the co-movement is likely driven by shared external factors (market-wide sentiment, liquidity, regulatory news) rather than one asset leading the other.
3. Notable Patterns and Non-Linearities The data shows a fan-like heteroscedastic pattern — variance in Y increases as X increases, meaning the spread of ETH prices widens at higher BTC price levels. This is typical of financial price data and suggests the relationship may be more linear in log-log space (percentage returns) than in raw price space. Sample points also hint at clustering by market regime: many low-BTC/low-ETH points cluster near the origin (bear market/early period), while higher BTC prices ($60K–$124K) show more scattered ETH values ($1,800–$4,800), indicating ETH's relative strength versus BTC varies across cycles (e.g., "altcoin season" effects). The linear fit (y = 0.0331x + 430) captures the broad trend but likely underfits during sharp bull/bear transitions where ETH tends to outperform or underperform BTC disproportionately.
4. Confounding Factors and Caveats This correlation is a classic case of spurious-looking co-integration in time series — both assets are driven by common macro factors (overall crypto market cap, BTC dominance shifts, interest rates, regulatory sentiment, exchange liquidity), not necessarily a direct causal link between the two prices. Additionally, since both series are non-stationary trending price levels (not returns), the high r² may partly reflect shared trend/drift over time rather than genuine short-term co-movement — a common pitfall in raw price-level correlation analysis. The lack of Granger causality reinforces that this is likely a "third-factor" driven relationship (e.g., overall crypto market beta) rather than a lead-lag trading signal.
5. Suggestions for Further Investigation - Re-run correlation and Granger tests on log-returns (daily % changes) rather than raw prices, which will better test for genuine short-term predictive relationships and avoid trend-driven spurious correlation. - Segment analysis by market regime (bull/bear/sideways) to see if the BTC-ETH relationship strengthens or weakens during specific periods — the ETH/BTC ratio itself is a commonly tracked metric. - Test additional lag structures in Granger causality (e.g., 1, 7, 14, 30 days) since crypto markets often show very short-term lead-lag effects that a 4-period lag may miss. - Incorporate a third variable (e.g., total crypto market cap, BTC dominance, or a macro liquidity index) to test whether it better explains the shared variance, which would support the "common driver" hypothesis over direct BTC→ETH causality.
X dataset: CryptoDataDownload – Binance BTC/USDT Daily OHLCV
Y dataset: Ethereum Historical Price Data
Part of experiment: Bitcoin - CryptoDataDownload – Binance BTC/USDT Daily OHLCV vs Ethereum Historical Price Data