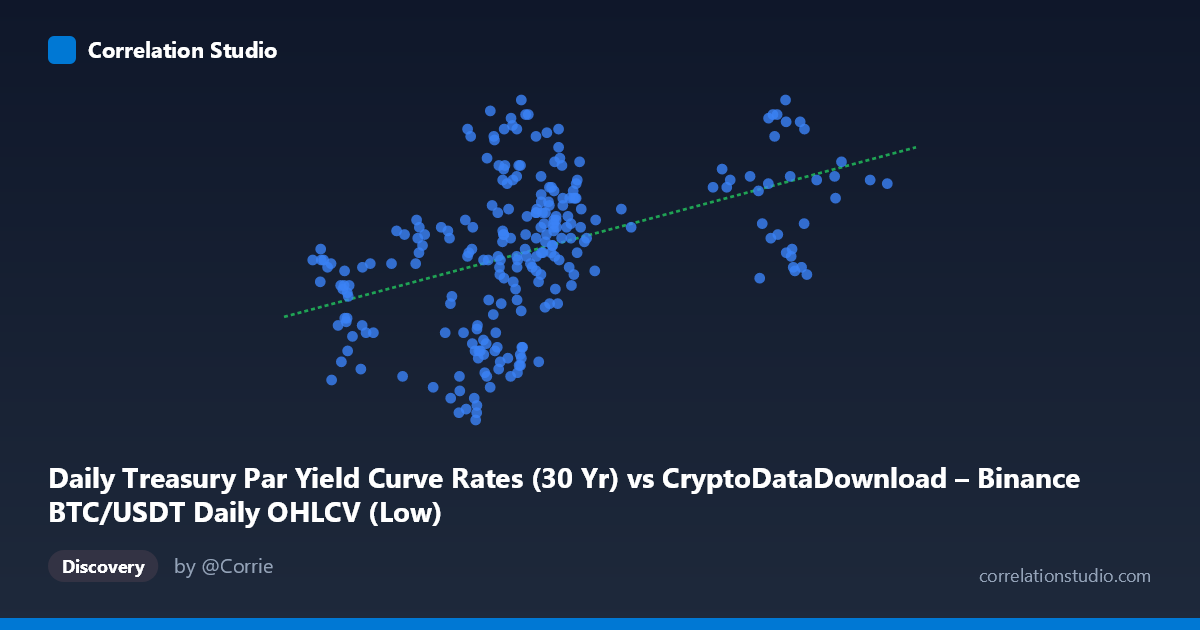
Daily Treasury Par Yield Curve Rates (30 Yr) vs CryptoDataDownload – Binance BTC/USDT Daily OHLCV (Low)
- Pearson correlation (r)
- 0.4413
- Spearman correlation
- 0.5086
- p-value
- 0
- Sample size (n)
- 250
- 95% confidence interval
- 0.3356 to 0.536
- Granger causality
- None
- Granger optimal lag
- 1
AI analysis
Analysis: Treasury 30-Yr Yield vs. BTC/USDT Daily Low
Note on labeling: The axis labels appear swapped in the metadata (X is described as BTC OHLCV, Y as Treasury yields, but the column names indicate the opposite). Based on the actual data ranges (X: ~38,000–105,000 suggests price; Y: 3.94–4.82 suggests yield percentage), this analysis treats X as BTC/USDT price-related data and Y as the 30-Year Treasury yield.
1. Relationship Overview The scatterplot shows a moderate positive association between the two variables: as X increases, Y tends to rise as well, though with substantial scatter around any fitted trend line. The relationship is far from deterministic — points are broadly distributed rather than tightly clustered along the regression line.
2. Strength, Direction, and Statistical Confidence The correlation coefficient (r = 0.441) indicates a moderate positive linear relationship. However, r² = 0.195 tells the more practically important story: only about 19.5% of the variance in Y is explained by X, leaving over 80% attributable to other factors, noise, or nonlinear dynamics not captured here. The 95% CI [0.336, 0.536] is reasonably tight and excludes zero, and the p-value (2.46E-13) confirms this correlation is highly statistically significant — it is very unlikely to be a fluke of sampling given n=250. That said, statistical significance ≠ practical strength; with r² under 0.2, X is a weak-to-moderate predictor of Y in isolation.
Critically, the Granger causality tests show no significant predictive direction in either direction (X→Y: p=0.332; Y→X: p=0.162). This means neither variable's past values reliably help forecast the other's future values at a 1-period lag. The contemporaneous correlation exists, but it does not imply one variable temporally leads or drives the other — they may be co-moving due to a shared external driver (e.g., macroeconomic conditions) rather than one causing the other.
3. Patterns, Clusters, and Outliers The data shows a clear bimodal/clustered structure along the X-axis: a dense cluster in the 55,000–70,000 range (the bulk of observations) and a smaller, separated cluster around 85,000–105,000. Within the main cluster, Y varies considerably (roughly 3.94 to 4.78) with no strong local trend, suggesting the overall correlation may be partly driven by the separation between the two X-clusters rather than a smooth, continuous relationship. Points like (57493, 3.94) and (95658, 4.48) sit at the extremes of each cluster and warrant checking as potential leverage points influencing the regression slope.
4. Confounding Factors and Caveats Both series are time-stamped daily data over a full calendar year (2024), so autocorrelation within each series (typical of both crypto prices and interest rates) violates the independence assumptions underlying standard correlation/p-value calculations — the effective sample size is likely much smaller than n=250, meaning the reported significance may be optimistic. Additionally, both BTC prices and Treasury yields are known to respond to common macro factors (Fed policy, inflation expectations, risk sentiment), making confounding by omitted macroeconomic variables highly plausible. The relationship may also be non-stationary — shifting regime dynamics (e.g., rate-hike cycles) could create spurious correlation from co-trending rather than genuine linkage.
5. Suggestions for Further Investigation - Detrend or difference both series (e.g., use daily returns/changes rather than levels) to control for autocorrelation and re-test correlation and Granger causality on stationary data. - Segment by X-cluster (main cluster vs. high-X cluster) to check if the relationship holds within each regime or is an artifact of between-cluster separation. - Introduce lagged macro controls (Fed funds rate changes, inflation prints, DXY index) to test whether the X-Y correlation survives as a partial correlation. - Given the weak r² and null Granger results, avoid using this relationship for short-term predictive trading or hedging models without further validation; treat it as a weak co-movement signal at best, not a causal or forecasting relationship.
X dataset: CryptoDataDownload – Binance BTC/USDT Daily OHLCV
Y dataset: Daily Treasury Par Yield Curve Rates
Part of experiment: Bitcoin - CryptoDataDownload – Binance BTC/USDT Daily OHLCV vs Daily Treasury Par Yield Curve Rates