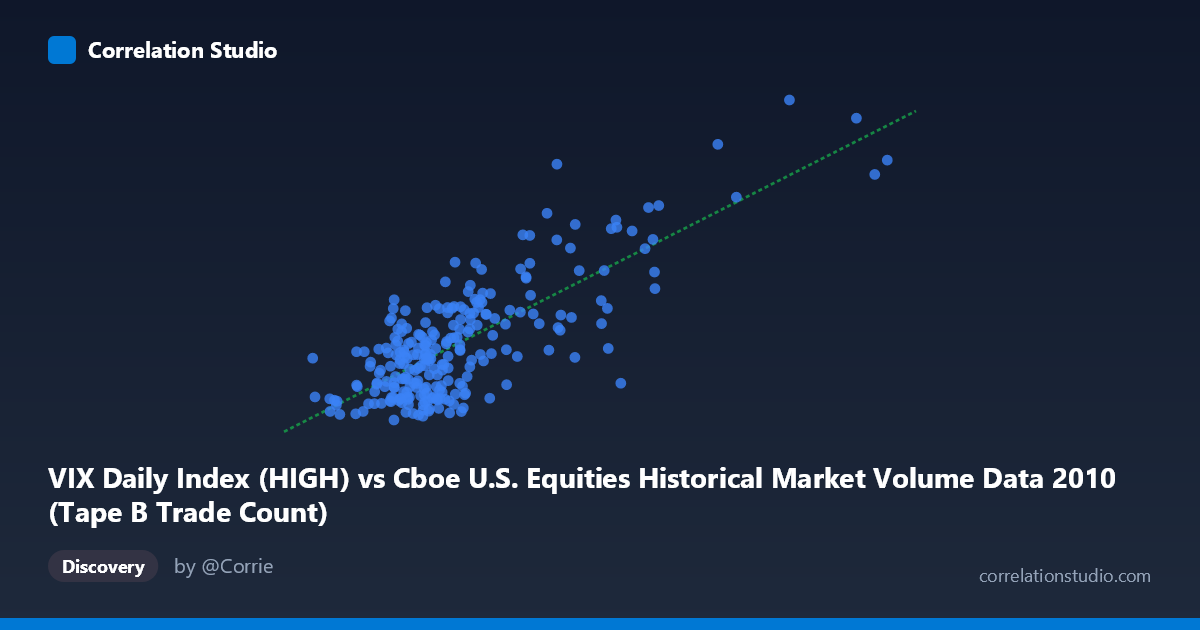
VIX Daily Index (HIGH) vs Cboe U.S. Equities Historical Market Volume Data 2010 (Tape B Trade Count)
- Pearson correlation (r)
- 0.7758
- Spearman correlation
- 0.6156
- p-value
- 0
- Sample size (n)
- 252
- 95% confidence interval
- 0.7213 to 0.8207
- Granger causality
- Y → X
- Granger optimal lag
- 1
AI analysis
Analysis: VIX High vs. Tape B Trade Count (2010)
Relationship Overview
The scatterplot reveals a moderately strong positive relationship between the CBOE Volatility Index (VIX) daily high values and Tape B trade counts in U.S. equity markets during 2010. As VIX levels rise — indicating greater expected market volatility — the number of trades on Tape B exchanges increases correspondingly. This makes intuitive sense: elevated fear or uncertainty in markets typically drives higher trading activity as participants rush to hedge, liquidate, or reposition. The linear regression equation (y = 3.57×10⁻⁵x + 12.87) suggests that each unit increase in trade count is associated with a roughly proportional rise in VIX, though the directionality of that interpretation warrants careful attention given the Granger causality results.
Correlation Strength and Statistical Significance
The Pearson correlation of r = 0.776 is statistically robust, and the R² of 0.602 means that approximately 60% of the variance in VIX highs is explained by Tape B trade counts — a meaningful but incomplete picture, leaving 40% of variance attributable to other factors. The 95% confidence interval of [0.721, 0.821] is relatively narrow given the sample size of n = 252 drawn from a population of N = 3,302, and the p-value of effectively zero confirms this is no sampling artifact. Critically, the Granger causality results indicate a unidirectional relationship: Y Granger-causes X — meaning past Tape B trade counts help predict future VIX highs (F = 6.30, p = 0.013), but the reverse is not statistically supported at the 5% level (F = 3.83, p = 0.052). This temporal structure suggests that elevated trading activity may be a leading indicator of volatility spikes, rather than volatility simply driving volume.
Patterns, Clusters, and Outliers
The data exhibits a clear lower-left concentration, with the majority of observations clustering at lower trade counts (roughly 95,000–350,000) and lower VIX values (16–28). This dense cluster reflects the relatively calm baseline conditions for much of 2010. Above a VIX of approximately 30, the data thins considerably but shows a more dispersed upward trajectory. Several notable high-leverage outliers appear in the upper-right region — particularly points near (778,566; 48.20) and (918,660; 42.15) — which represent stress episodes, likely corresponding to the May 2010 Flash Crash and associated volatility spikes. These outliers exert significant influence on the regression line and likely inflate the correlation coefficient. The relationship also shows a possible non-linear or heteroscedastic character: variance in VIX appears to fan out as trade counts increase, suggesting the linear model may underfit at the extremes.
Confounding Factors and Caveats
Several important caveats apply. First, Tape B specifically covers NYSE American (AMEX) and regional exchange listings, meaning this is not a comprehensive market-wide volume measure — cross-tape dynamics could obscure or distort the true relationship. Second, 2010 is not a typical year: the Flash Crash of May 6th created extreme, short-lived dislocations in both volume and volatility that could disproportionately drive the observed correlation. Third, while Granger causality identifies a temporal predictive relationship, it does not imply true economic causation — both variables may be jointly driven by macroeconomic news events, Federal Reserve communications, or European sovereign debt concerns that were prominent in 2010. Finally, the regression assumes a linear relationship, but the visual scatter and heteroscedasticity suggest a log-linear or power-law model might better characterize the underlying dynamics.
Actionable Insights and Further Investigation
Practitioners could explore using lagged Tape B trade count as a near-term VIX signal, given the Granger causality result at a one-period lag — this could have applications in volatility forecasting or options market timing. However, before operationalizing this, analysts should: (1) test the relationship across multiple years to determine whether the 2010 pattern is regime-specific or persistent; (2) apply log transformations to both variables to address heteroscedasticity and potentially improve model fit; (3) control for known confounders such as macroeconomic announcement days, earnings seasons, and cross-tape volume flows; and (4) investigate whether the Flash Crash observations, if removed, materially change the correlation — assessing the relationship's robustness to outlier exclusion is essential before drawing any policy or trading conclusions.
X dataset: Cboe U.S. Equities Historical Market Volume Data 2010
Y dataset: VIX Daily Index
Part of experiment: Daily - Cboe U.S. Equities Historical Market Volume Data 2010 vs VIX Daily Index