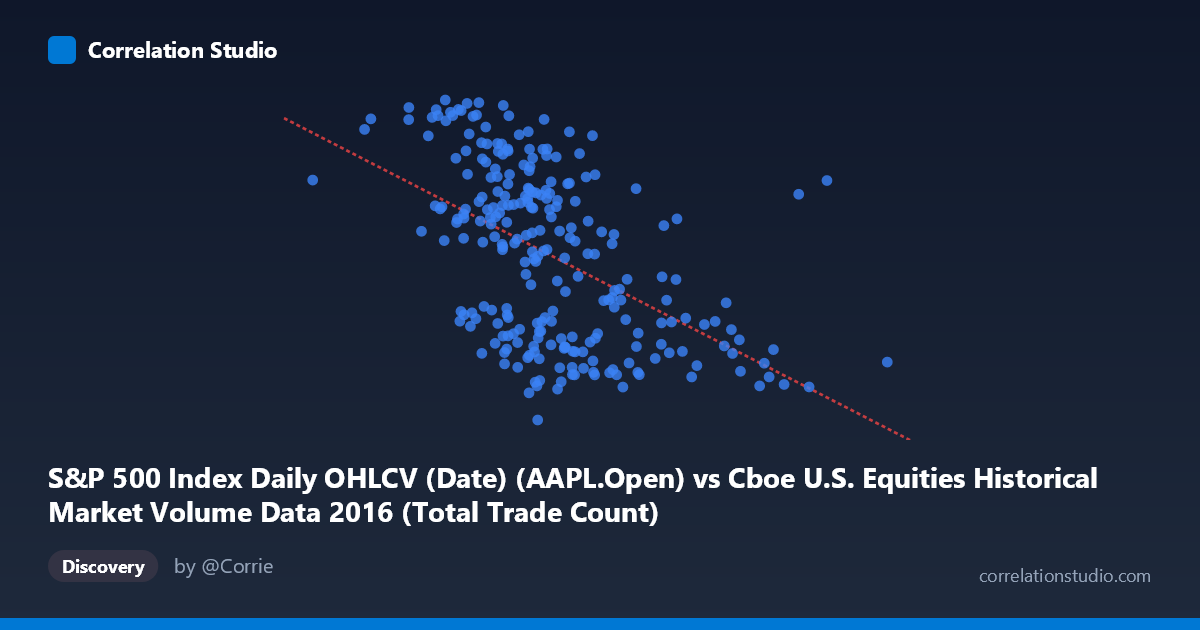
S&P 500 Index Daily OHLCV (Date) (AAPL.Open) vs Cboe U.S. Equities Historical Market Volume Data 2016 (Total Trade Count)
- Pearson correlation (r)
- -0.5084
- Spearman correlation
- -0.5351
- p-value
- 0
- Sample size (n)
- 252
- 95% confidence interval
- -0.5946 to -0.4106
- Granger causality
- None
- Granger optimal lag
- 1
AI analysis
Analysis of AAPL Opening Price vs. Cboe Total Trade Count (2016)
Relationship Overview The scatterplot reveals a moderate negative relationship between Apple's (AAPL) daily opening price on the S&P 500 and the total trade count on Cboe U.S. equity exchanges throughout 2016. As AAPL's opening price increases, overall market trade counts tend to decline. The linear regression equation (y = -7.29×10⁻⁶x + 122.163) confirms this inverse slope, suggesting that for every unit increase in AAPL's opening price, total trade count decreases by a small but consistent margin. Visually, the data points show a discernible downward trend across the X range (~$94 to $118), though with considerable scatter, indicating the relationship is real but far from deterministic.
Correlation Strength and Statistical Significance The Pearson correlation of r = -0.508 indicates a moderate negative association, but the explanatory power is notably limited — R² = 0.2585 means only ~25.8% of the variance in total trade count is explained by AAPL's opening price. The remaining ~74% is attributable to other factors entirely. The 95% confidence interval of [-0.595, -0.411] is entirely negative, excluding zero, and the p-value is effectively 0 (with n = 252), confirming the correlation is statistically robust and not a sampling artifact. However, statistical significance should not be conflated with practical or causal significance — the effect size is modest. Critically, Granger causality tests reveal no significant predictive directionality in either direction (X→Y: F = 1.17, p = 0.28; Y→X: F = 0.72, p = 0.40), meaning neither variable temporally predicts the other at the optimal lag of 1 period. This substantially weakens any causal narrative.
Notable Patterns and Outliers The sample points reveal meaningful clustering behavior. Lower AAPL opening prices (~$90–$96 range) tend to cluster toward lower trade counts (92–100 range), while mid-range prices (~$105–$116) show more vertical dispersion — suggesting heteroscedasticity, where variance in trade count is larger at higher price levels. Several outliers are visible: points like (1,619,945, 106.62) and (1,722,715, 116.80) sit at unusually low X values (trade counts) for relatively high AAPL prices, potentially representing low-volume trading days. Conversely, high-volume days around X = 3.3–3.6M appear at relatively low AAPL prices, reinforcing the negative trend. There is no strong visual evidence of a non-linear relationship, though the scatter is wide enough that a mild curve cannot be ruled out.
Confounding Factors and Interpretive Caveats Several important caveats apply. First, the axis labels appear transposed — the X-axis is described as AAPL Open price (ranging in the millions) while Y-axis values (90–118) align more naturally with price levels, suggesting a possible metadata labeling inconsistency that warrants verification before drawing conclusions. Second, both variables are time-indexed across 2016, making them susceptible to shared macro confounders — market-wide volatility events (e.g., Brexit in June 2016, U.S. election in November 2016) could simultaneously depress prices and spike trading volumes. Third, AAPL is just one constituent of the S&P 500, and its price alone is a narrow proxy for broader market conditions. Finally, the relationship may be spurious correlation driven by common temporal trends rather than any meaningful economic mechanism.
Actionable Insights and Further Investigation Despite the Granger causality null result, the moderate correlation warrants deeper exploration. Analysts should control for calendar effects and known volatility events (e.g., earnings dates, macro shocks) to isolate whether the relationship persists after detrending. Incorporating VIX (volatility index) data as a covariate could reveal whether market uncertainty is the true driver of both lower prices and higher trade counts — a classic fear-driven trading dynamic. Extending the analysis to multiple years would test whether the 2016 relationship is structurally stable or an artifact of that year's unique market events. Finally, applying rolling correlation windows could expose time-varying dynamics invisible in a static annual correlation, and a multivariate regression framework would better quantify AAPL's independent contribution relative to broader market factors.
X dataset: Cboe U.S. Equities Historical Market Volume Data 2016
Y dataset: S&P 500 Index Daily OHLCV (Date)
Part of experiment: Daily - Cboe U.S. Equities Historical Market Volume Data 2016 vs S&P 500 Index Daily OHLCV (Date)