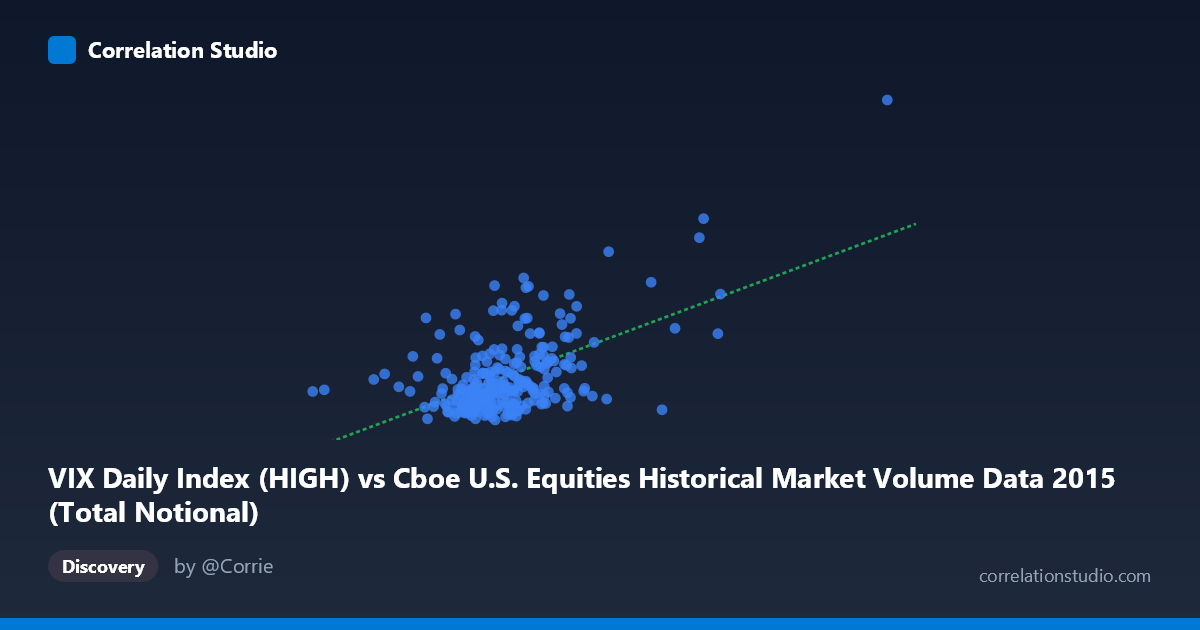
VIX Daily Index (HIGH) vs Cboe U.S. Equities Historical Market Volume Data 2015 (Total Notional)
- Pearson correlation (r)
- 0.5568
- Spearman correlation
- 0.4046
- p-value
- 0
- Sample size (n)
- 252
- 95% confidence interval
- 0.4652 to 0.6366
- Granger causality
- None
- Granger optimal lag
- 1
AI analysis
Analysis: VIX Daily Index (HIGH) vs. Total Notional Market Volume (2015)
Relationship Overview
The scatterplot reveals a moderate positive relationship between the VIX Daily Index High values and Total Notional trading volume in U.S. equities markets during 2015. As VIX levels rise, total notional volume tends to increase, which aligns intuitively with market microstructure theory: elevated volatility typically drives higher trading activity as investors rebalance portfolios, hedge exposures, or react to uncertainty. The linear regression equation (y = 6.59×10⁻¹⁰x + 3.79) confirms this upward slope, though the relatively modest intercept suggests a baseline level of volatility exists even at lower volume levels.
Correlation Strength and Statistical Framing
The correlation of r = 0.557 is statistically significant (p ≈ 0), and with a sample of n = 252 drawn from a population of N = 3,302, the 95% confidence interval of [0.465, 0.637] is meaningfully narrow, lending credibility to the estimate. However, r² = 0.31 is the more important practical figure: only 31% of the variance in VIX is explained by notional volume, meaning roughly two-thirds of VIX variation is driven by factors entirely outside this model. While the relationship is real and non-trivial, it is far from deterministic. Crucially, Granger causality tests reveal no significant predictive direction in either direction (X→Y: F = 0.24, p = 0.62; Y→X: F = 0.0003, p = 0.99), meaning that past values of notional volume do not help forecast future VIX levels, and vice versa. This strongly suggests the observed correlation reflects contemporaneous co-movement — likely driven by shared external triggers — rather than any lead-lag causal mechanism that could be exploited for prediction.
Notable Patterns, Clusters, and Outliers
The data exhibits several visually distinct features. A dense cluster is concentrated in the lower-left region, roughly where notional volume falls between ~15–25 billion and VIX readings sit between 12–22, representing the majority of "normal" trading days in 2015. Above VIX ≈ 25, the distribution fans out considerably, suggesting heteroscedasticity — variance in notional volume increases at higher volatility levels, which is a common feature of financial data. Several notable outliers appear in the upper-right quadrant, including points near VIX = 38–53 paired with very high notional volumes (e.g., ~35–49 billion), likely corresponding to the August 2015 market correction ("Flash Crash"), when both volatility and trading volumes spiked dramatically. The point at VIX ≈ 53 stands alone as a potential extreme outlier that may disproportionately influence the correlation coefficient.
Confounding Factors and Caveats
Several important caveats temper this analysis. First, reverse causality and simultaneity are plausible — high volatility may drive volume, but high volume can itself amplify price swings and elevate VIX readings, creating a feedback loop that a simple bivariate correlation cannot untangle. Second, macro events in 2015 (China slowdown concerns, Federal Reserve rate hike anticipation, the August correction) created episodic spikes that simultaneously drove both variables, meaning the correlation may partly reflect event-driven co-movement rather than a structural relationship. Third, the dataset covers only a single calendar year, limiting generalizability; the relationship between VIX and notional volume may differ substantially across different market regimes. Finally, the extreme outliers from August 2015 may be inflating r; removing them could materially weaken the measured correlation.
Actionable Insights and Further Investigation
Despite the lack of Granger causality, the moderate contemporaneous correlation (r = 0.56) and its economic intuition make it worth investigating further. Practitioners should test whether the relationship is regime-dependent — separating low-VIX periods (VIX < 20) from high-VIX periods (VIX 25) and fitting separate models would reveal whether the correlation is driven primarily by stress episodes. It would also be valuable to introduce lagged variables at longer horizons (beyond the single-period lag tested here) and include additional controls such as S&P 500 returns, bid-ask spreads, or options open interest to build a more explanatory multivariate model. Finally, replicating this analysis across multiple years would clarify whether 2015's unique events (particularly August) are driving the finding or whether this reflects a durable structural relationship in U.S. equity markets.
X dataset: Cboe U.S. Equities Historical Market Volume Data 2015
Y dataset: VIX Daily Index
Part of experiment: Daily - Cboe U.S. Equities Historical Market Volume Data 2015 vs VIX Daily Index