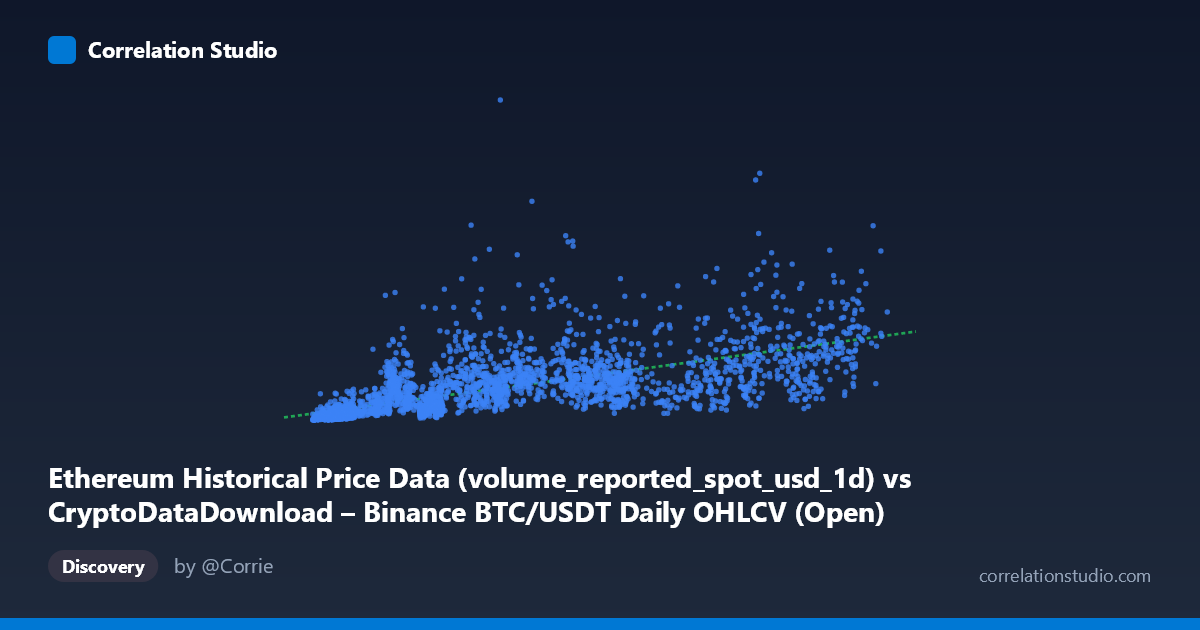
Ethereum Historical Price Data (volume_reported_spot_usd_1d) vs CryptoDataDownload – Binance BTC/USDT Daily OHLCV (Open)
- Pearson correlation (r)
- 0.6766
- Spearman correlation
- 0.8424
- p-value
- 0
- Sample size (n)
- 3191
- 95% confidence interval
- 0.6573 to 0.6949
- Granger causality
- Y → X
- Granger optimal lag
- 10
AI analysis
Analysis: BTC/USDT Volume vs. Ethereum Open Price
1. Overview of the Relationship
The scatterplot depicts a positive association between a volume-based metric (labeled as Ethereum "volumereportedspotusd1d" but sourced from BTC/USDT data) and Ethereum's opening price. As the X-variable increases from roughly 3,200 to 124,600, the Y-variable trends upward from ~108 million to ~53.7 billion, though with substantial scatter. The relationship is visibly heteroscedastic — variance in Y grows dramatically as X increases, creating a cone- or fan-shaped spread rather than a tight linear band. This pattern, combined with the note that Spearman's ρ exceeds Pearson's r, strongly suggests the true relationship is monotonic but non-linear (e.g., logarithmic, power-law, or square-root in X).
2. Strength, Direction, and Statistical Confidence
The Pearson correlation (r = 0.677) indicates a moderate-to-strong positive linear relationship, but r² = 0.458 reveals that less than half (45.8%) of the variance in Y is explained by X in a linear framework — meaning most of the variation in Ethereum's price is driven by factors outside this single predictor. The 95% CI [0.657, 0.695] is narrow, reflecting the large sample size (n=3,191) and giving high confidence that the true population correlation is reliably positive and non-trivial — reinforced by p ≈ 0. However, statistical significance here reflects sample size more than practical strength; a moderate r² still leaves considerable unexplained variance for any predictive or trading application.
The Granger causality results add a temporal dimension: Y Granger-causes X, not the other way around (Y→X: F=2.43, p=0.0069; X→Y: F=1.26, p=0.245, not significant). This implies that past values of Ethereum's price have predictive power over future values of the volume metric, but not vice versa. This is an important reframe — the naive assumption that "volume drives price" is not supported here; instead, price movements appear to lead volume/derived-X changes with an optimal lag of 10 periods (likely days, given daily OHLCV data).
3. Notable Patterns and Outliers
Several sample points stand out: at X≈40,680, Y jumps to ~14.6 billion, and at X≈56,425–57,037, Y reaches 13.7–15.0 billion — both are high-Y outliers relative to neighboring X values, suggesting episodic spikes (likely tied to specific market events, halvings, or volatility clusters) rather than smooth scaling. Conversely, many low-X points (X<10,000) cluster tightly with low Y (under ~1 billion), showing a much more linear, low-variance regime at the low end. The transition from tight clustering at low X to wide dispersion at high X is the strongest visual signature of non-linearity and suggests a multiplicative or log-normal error structure rather than additive noise.
4. Confounding Factors and Caveats
There are significant data provenance concerns here: the axis labels are inconsistent/mismatched (X is labeled as an Ethereum volume column but described as sourced from Binance BTC/USDT OHLCV data; Y is labeled as BTC/USDT Open but described as Ethereum price data). This suggests a labeling error in the dataset merge, and any interpretation should first resolve which asset each axis truly represents. Additionally, BTC and ETH prices are both driven by shared macro-crypto market sentiment, Bitcoin dominance effects, and overall exchange volume trends — a classic case of confounding via a common market-wide factor (e.g., overall crypto market cap, regulatory news, or stablecoin flows) rather than a direct causal link between these two specific series. Time-series data also violates the independence assumption of Pearson/Granger tests unless properly differenced or detrended — trending, non-stationary series can produce spurious correlations and even spurious Granger causality.
5. Recommendations for Further Investigation
1. Resolve the axis/data labeling discrepancy before drawing asset-specific conclusions — confirm whether this is truly BTC volume vs. ETH price or a mislabeled single-asset relationship. 2. Test stationarity (ADF/KPSS tests) and consider differencing or log-transforming both series before re-running correlation and Granger tests, since non-stationary trending data can inflate both r and Granger significance spuriously. 3. Fit non-linear models (log-log, polynomial, or quantile regression) given the heteroscedastic fan pattern and the Spearman Pearson signal — a log(X) vs log(Y) transformation is a natural next step for volume-price relationships. 4. Investigate the high-Y outlier cluster around X≈40,000–57,000 to identify if these correspond to specific dates/events (e.g., 2021 bull run, ETF announcements) that may warrant separate regime modeling. 5. Extend Granger analysis with control variables (e.g., overall market cap, BTC dominance) to rule out confounding and better isolate any genuine directional predictive relationship between the two series.
X dataset: CryptoDataDownload – Binance BTC/USDT Daily OHLCV
Y dataset: Ethereum Historical Price Data
Part of experiment: Bitcoin - CryptoDataDownload – Binance BTC/USDT Daily OHLCV vs Ethereum Historical Price Data